Platinum-group metals: what they are, what platinum is used for, where it is mined and figures
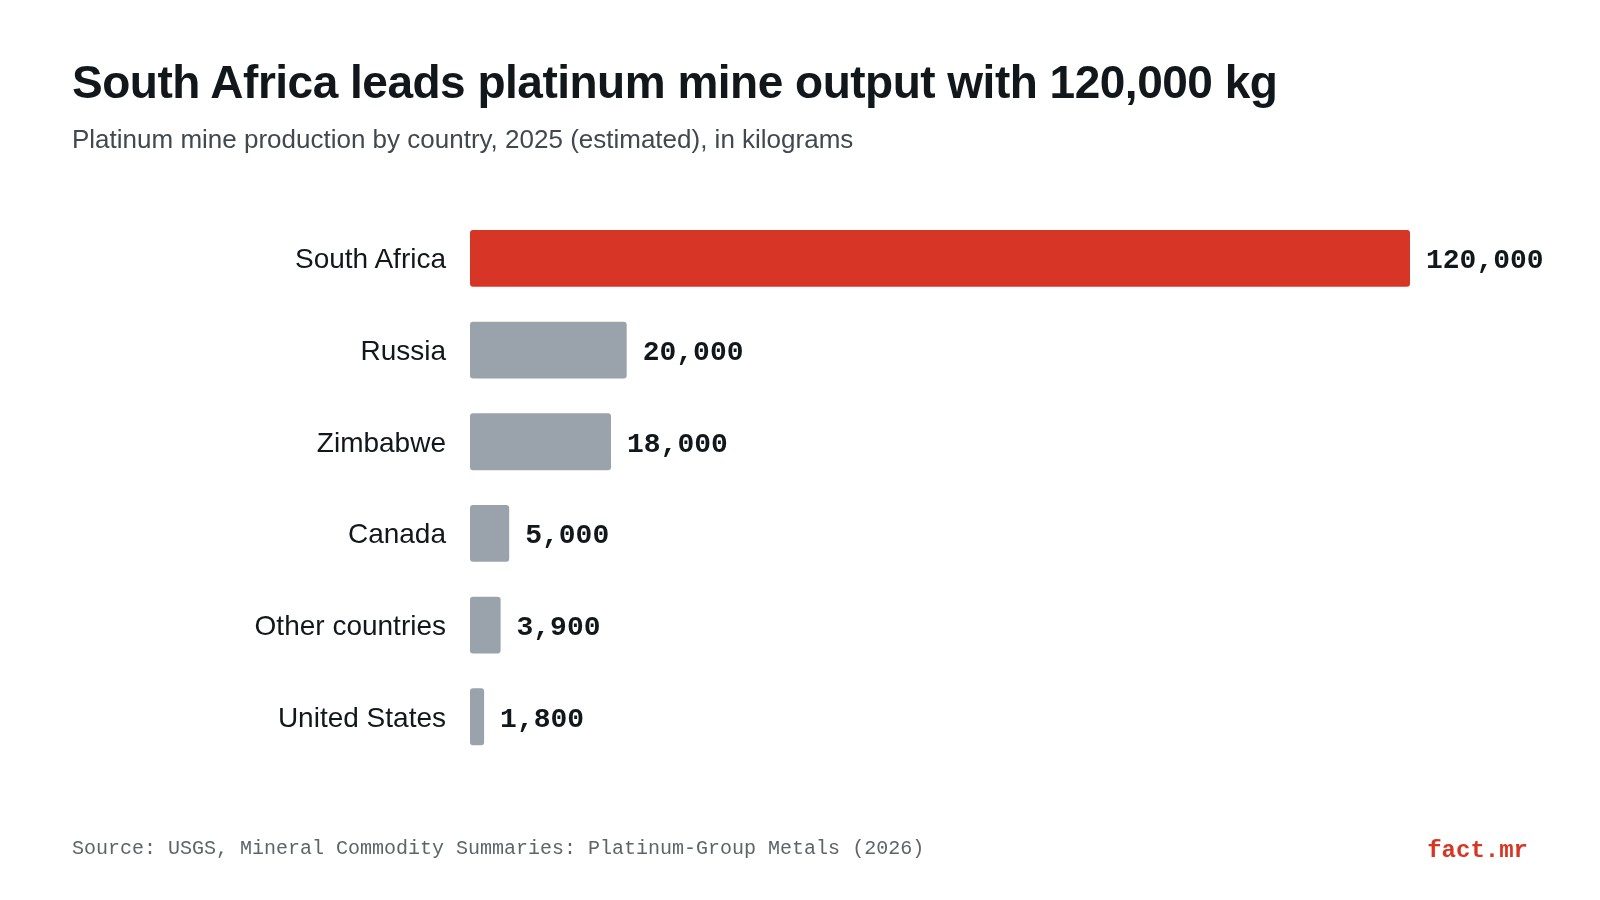
South Africa mined an estimated 120,000 kg of the world's 170,000 kg of platinum in 2025, per USGS. Uses of platinum and palladium, and who mines them.
In this article
The largest use of platinum-group metals, platinum included, is in catalytic converters that clean car exhaust, according to the USGS. It also ends up in catalysts for oil refining and chemicals, in fine jewelry, glass, dental and medical devices, electronics and investment. Mines produced an estimated 170,000 kilograms of platinum in 2025, according to the USGS Mineral Commodity Summaries 20262.
Key points
- The USGS has named the automotive industry as the principal consumer of platinum-group metals (PGMs) since 1979. Their main use is in catalytic converters.
- South Africa mined an estimated 120,000 kg of platinum in 2025, or 70.6% of the world total of 170,000 kg (USGS).
- Russia leads in palladium, with an estimated 84,000 kg in 2025, or 44.2% of the world's 190,000 kg.
- The US relied on imports for an estimated 89% of its apparent platinum consumption in 2025, up from 85% in 2024.
- The USGS estimates the 2025 average platinum price at $1,200 per troy ounce, a 25% rise over 2024.
The six platinum-group metals
The USGS puts six elements in the group: iridium, osmium, palladium, platinum, rhodium and ruthenium1. They usually occur together in the same ore and are refined together. In trade statistics they share the label PGMs.
The name came from Spanish colonists. When they first found the metal in Colombia, they called it platina, or "little silver," according to the USGS1.
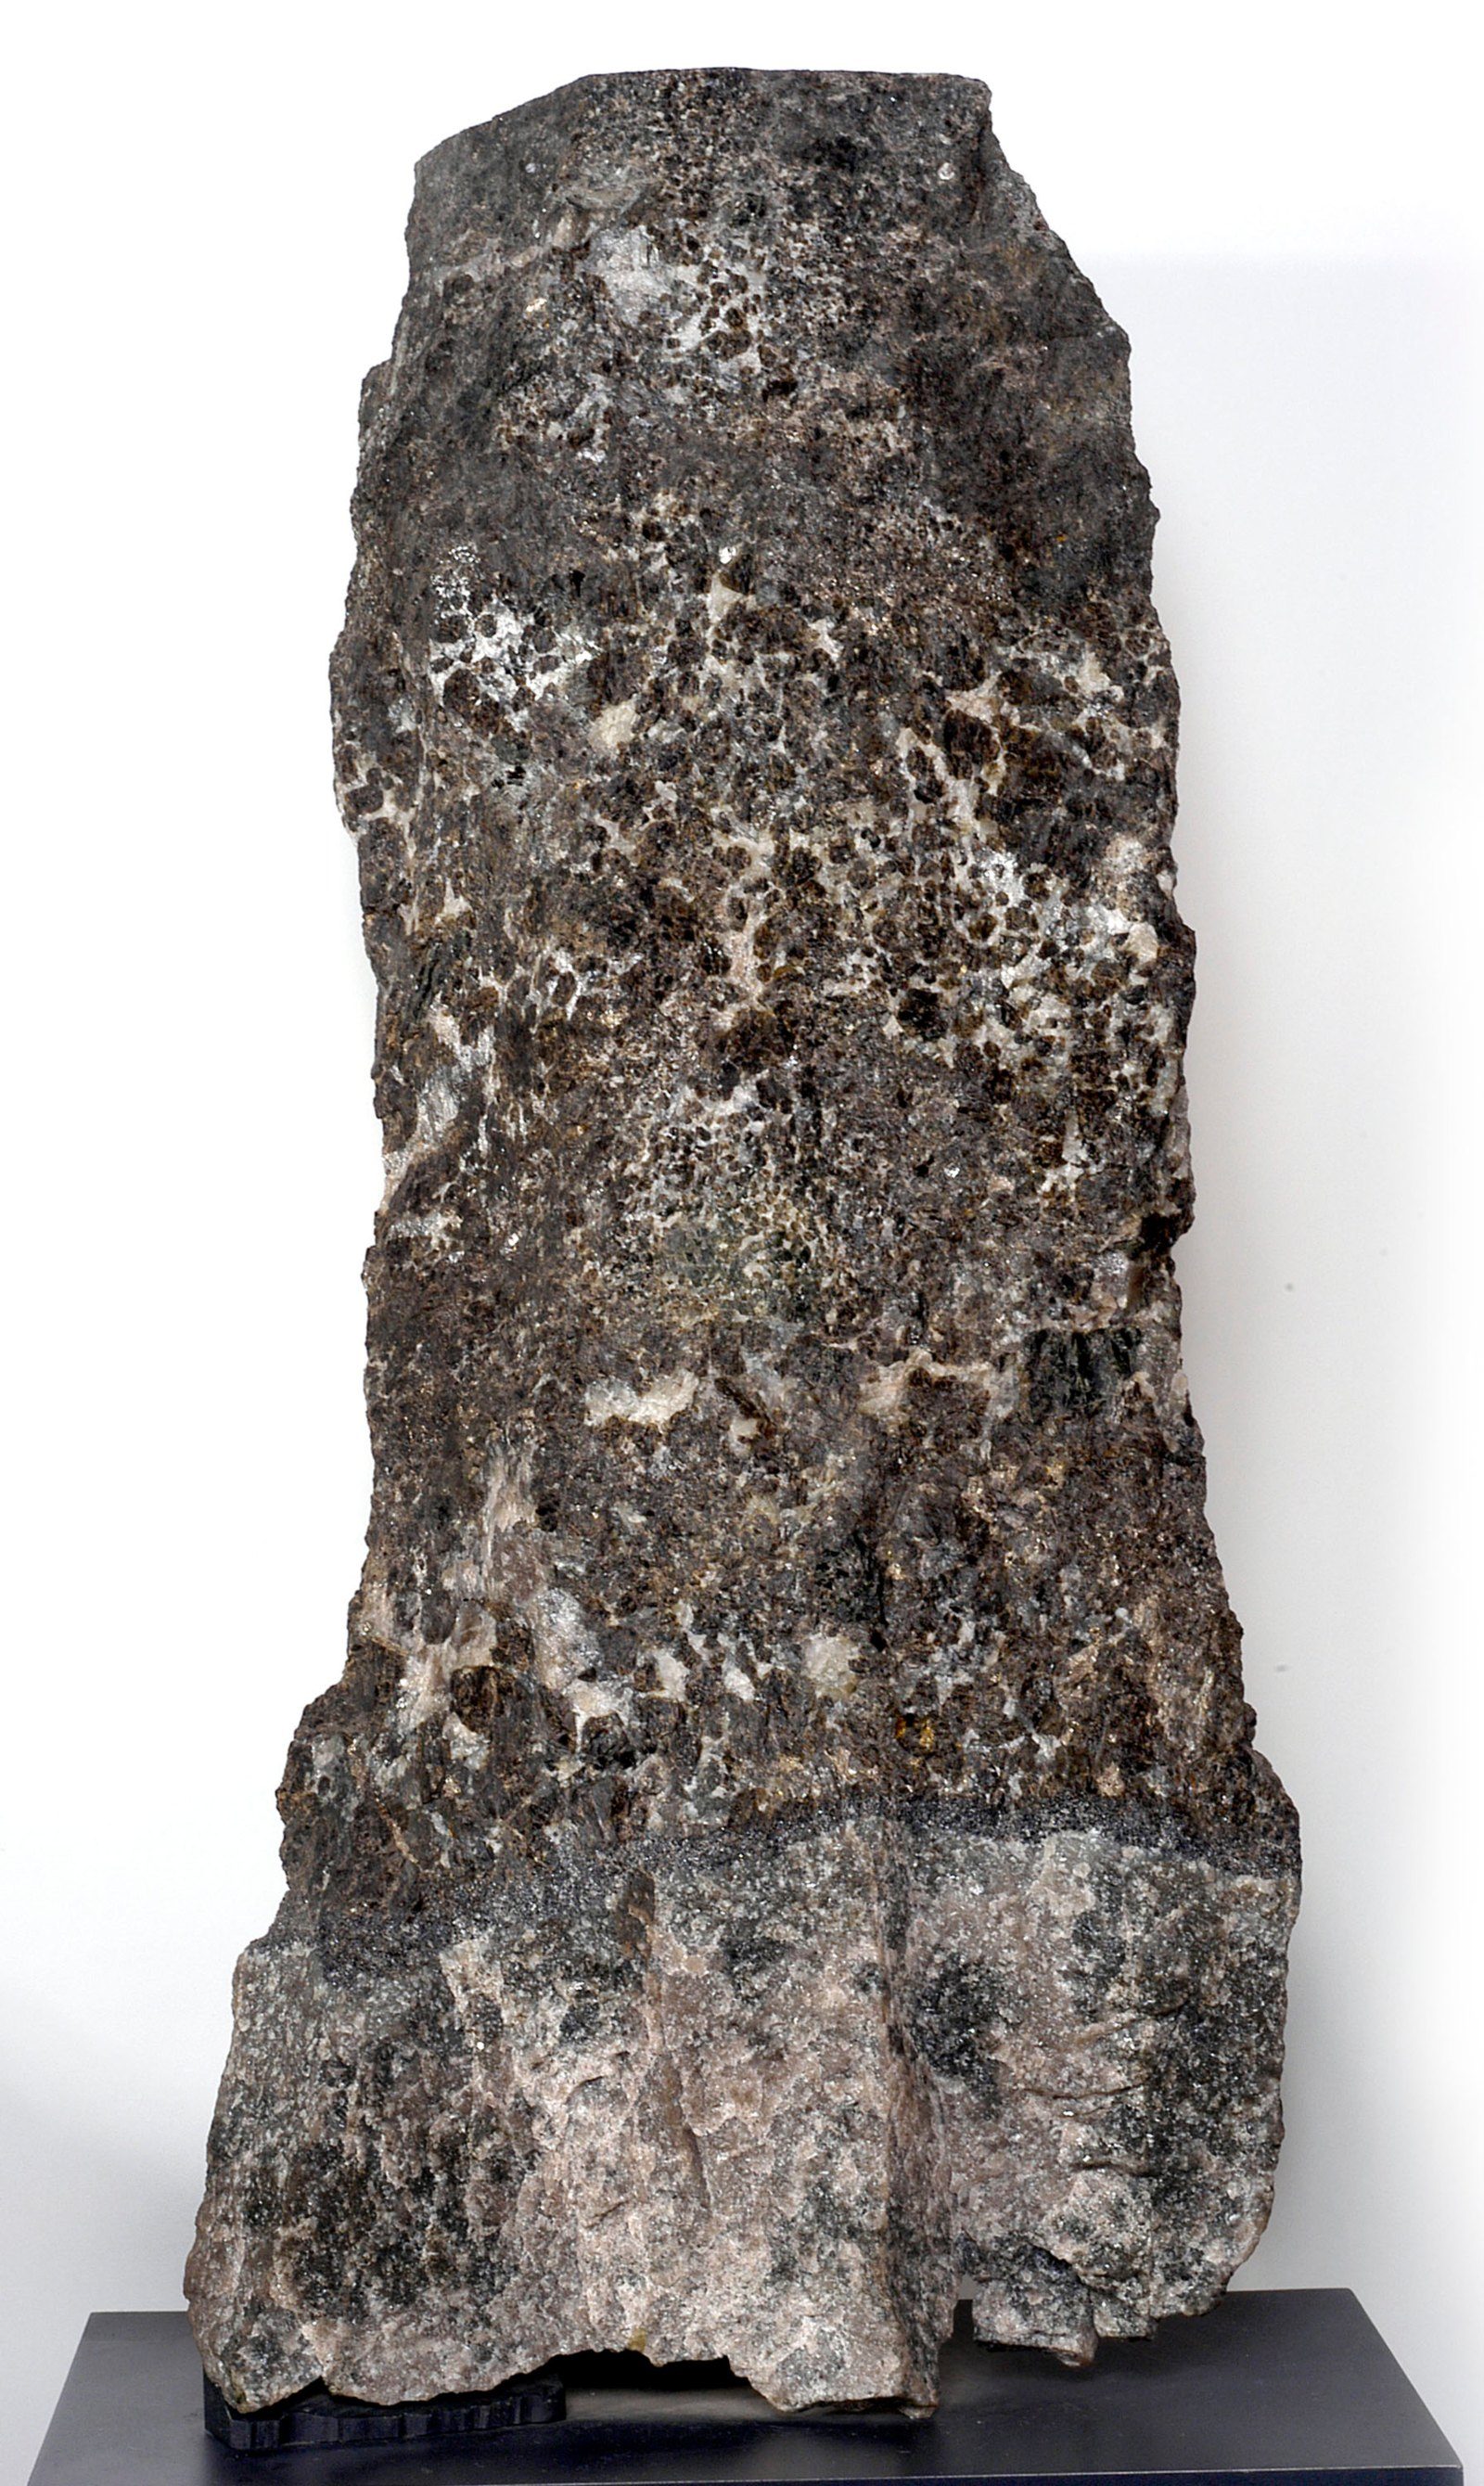
The USGS keeps a long record of these metals. It has posted every PGM edition of its Mineral Commodity Summaries from 1996 to 20261. Its Data Series 140 covers about 90 minerals, and for many of them the data go back to 19006.
What platinum is used for
In the US, the main use of PGMs was in catalytic converters that cut harmful emissions from cars, according to the Mineral Commodity Summaries 20262. The same source lists several other uses: catalysts for bulk chemicals and refining, dental and medical devices, electronics such as computer hard disks, glass, investment, jewelry and laboratory equipment.
| Use | Metals involved | What the USGS says |
|---|---|---|
| Car catalytic converters | Palladium, platinum, rhodium | Used as an oxidation catalyst to treat car exhaust emissions |
| Petroleum refining | Platinum | Platinum-supported catalysts are used to refine crude oil, in reforming and in other processes |
| Nitric acid and fertilizers | Platinum or platinum-rhodium alloy | Catalyze the partial oxidation of ammonia into nitric oxide, the raw material for fertilizers, explosives and nitric acid |
| Jewelry | Platinum | Its resistance to wear and tarnish suits fine jewelry |
| Other | PGMs | Dental and medical devices, hard disks, glass, investment, laboratory equipment |
Catalytic converters and the palladium swap
Platinum and palladium compete for the same job. According to the USGS, palladium has replaced platinum in most gasoline-engine catalytic converters because it has historically cost less2. In its 2026 edition the agency described the reverse move as well: substitution of platinum in automobile catalysts was one of the reasons it gave for higher prices.
Chemicals, refining and fertilizer
Few people see this part of the demand. A platinum or platinum-rhodium catalyst turns ammonia into nitric oxide, and that compound becomes nitric acid, explosives and fertilizers1. Sulfur goes through a similar chain from raw material to fertilizer, covered in the fact.mr note on sulfur supply.
The USGS summary lists these uses but gives no share for each, so it does not answer how much platinum goes into jewelry and how much into converters.
Where platinum comes from
The largest PGM resources and reserves are in the Bushveld Complex in South Africa, according to the USGS2. That one geological formation explains most of the chart above. South Africa, Russia and Zimbabwe together mined 92.9% of the world's platinum in 2025, by the USGS estimates.
| Country | Platinum 2024 (kg) | Platinum 2025e (kg) | Palladium 2024 (kg) | Palladium 2025e (kg) |
|---|---|---|---|---|
| South Africa | 126,000 | 120,000 | 82,600 | 70,000 |
| Russia (estimated) | 22,000 | 20,000 | 89,000 | 84,000 |
| Zimbabwe | 18,400 | 18,000 | 15,200 | 15,000 |
| Canada | 5,700 | 5,000 | 17,000 | 16,000 |
| United States | 3,010 | 1,800 | 10,200 | 6,200 |
| Other countries | 3,860 | 3,900 | 2,870 | 2,900 |
| World total (rounded) | 179,000 | 170,000 | 217,000 | 190,000 |
Source: USGS, Mineral Commodity Summaries 20262. "e" means estimated. The USGS rounds world totals, so the country rows do not add up to them exactly (and the Russian figures are estimates for both years).
World platinum output fell 5.0% in 2025 compared with 2024. In South Africa, PGM production dropped by an estimated 9%, which the USGS attributes to falling palladium prices. Russia's output fell 6% because of lower metal grades and ore recovery, the same source says2.
Two editions, two figures for 2024
The 2024 figures changed between editions. The Mineral Commodity Summaries 2025 estimated world mine output for 2024 at 170,000 kg of platinum and 190,000 kg of palladium3. The 2026 edition revised those figures to 179,000 kg and 217,000 kg2.
The longer series, from the USGS Minerals Yearbook 2023, puts world platinum output at 187,000 kg in 2019, 163,000 kg in 2020, 193,000 kg in 2021, 176,000 kg in 2022 and 179,000 kg in 20234. Readers comparing the 2021 and 2022 values should know that both are revised figures.
Palladium has a different map. Russia leads with an estimated 84,000 kg in 2025, which is 44.2% of the world total, ahead of South Africa with 70,000 kg. The same pattern of output concentrated in a few countries shows up for nickel and for rare earth elements.
The US case: imports and Mexico
PGMs are mined and processed in the US by one company in Montana, according to the USGS. The USGS estimates the value of the metals it mined and processed at $290 million in 2025, a 31% drop from $420 million in 20242. But the previous edition had put the 2024 value at about $310 million3, so the two editions disagree on that year.
| Metal | Net import reliance 2024 | Net import reliance 2025e | Import sources, 2021–24 |
|---|---|---|---|
| Platinum | 85% | 89% | South Africa 49%, Belgium 10%, Germany 10%, Italy 8%, other 23% |
| Palladium | 34% | 57% | South Africa 37%, Russia 36%, Belgium 6%, Canada 6%, other 15% |
Source: USGS, Mineral Commodity Summaries 20262. Net import reliance is shown as a share of apparent consumption.
The US imported an estimated 99,000 kg of platinum for consumption in 2025. Its apparent consumption, which excludes scrap, was an estimated 92,000 kg. Unwrought and semimanufactured PGMs enter duty free under normal trade relations2.
Trade with Mexico is small. In 2023 the US imported 200 kg of palladium from Mexico, worth $3,240 thousand, and exported 402 kg of platinum to Mexico, worth $16,100 thousand, according to the USGS Minerals Yearbook4.
Platinum price
So why did platinum get more expensive in a year when mines produced less of it? The USGS gives three reasons: substitution of platinum in automobile catalysts, lower production and higher demand2. It estimates that average prices rose 53% for ruthenium, 25% for platinum, 24% for rhodium and 11% for palladium in 2025.
| Year | Platinum, annual average (US$ per troy ounce) |
|---|---|
| 2021 | 1,094.31 |
| 2022 | 966.54 |
| 2023 | 973.00 |
| 2024 | 960.70 |
| 2025 (estimated) | 1,200 |
Source: USGS, Mineral Commodity Summaries 2026, Engelhard price for unfabricated metal2. Palladium averaged $994.90 per troy ounce in 2024 and an estimated $1,100 in 2025.
The monthly USGS data give a different figure. Its Mineral Industry Surveys for April 2026 put the 2025 platinum average at $1,284.94, higher than the $1,200 estimate published in the annual summary5. The same survey shows a preliminary January to April 2026 average of $2,170.77 and a high of $2,821 for that period.
The fact.mr guide to raw materials covers how commodity prices move in general.
Can platinum run out?
Not on current figures. The USGS estimates world PGM resources at more than 100 million kilograms. World reserves total more than 76,000,000 kg, and South Africa holds 63,000,000 kg of them2.
Recycling also supplies metal: about 140,000 kg of palladium and platinum were recovered worldwide from new and old scrap in 2025, according to the USGS. That amount is close to the 170,000 kg of platinum mined that year. The USGS does not publish a separate recycling figure for each of the two metals.
Frequently asked questions
What is platinum used for most?
Catalytic converters. The USGS has named the automotive industry as the principal consumer of platinum-group metals since 1979. In the US, their main use is in converters that cut harmful emissions from cars, and the USGS also lists catalysts for oil refining and chemicals, jewelry, glass, electronics, medical devices and investment, without a share for each.
Which country produces the most platinum?
South Africa, by a wide margin: it mined an estimated 120,000 kg of the world's 170,000 kg of platinum in 2025, a 70.6% share, according to the USGS. Russia followed with 20,000 kg and Zimbabwe with 18,000 kg. The Bushveld Complex holds the largest known resources.
What is the difference between platinum and palladium?
Both are platinum-group metals, and both are used in car catalysts. The USGS says palladium replaced platinum in most gasoline-engine converters because it historically cost less. They are mined in different places: Russia leads in palladium with an estimated 84,000 kg in 2025, while South Africa leads in platinum.
Does the US produce its own platinum?
Only a little: US mines produced an estimated 1,800 kg of platinum in 2025, down from 3,010 kg in 2024, according to the USGS. Imports covered an estimated 89% of apparent consumption. South Africa supplied 49% of US platinum imports between 2021 and 2024.
Sources
- U.S. Geological Survey, "Platinum-Group Metals Statistics and Information" (current page). The six PGMs, the auto industry as the main consumer since 1979, the uses in catalysts, chemicals and jewelry, the origin of the name and the list of editions. usgs.gov. Accessed Nov 12, 2026.
- U.S. Geological Survey, "Mineral Commodity Summaries 2026: Platinum-Group Metals" (2026). Mine production and reserves by country, uses, US imports and import reliance, prices, recycling and resources. pubs.usgs.gov. Accessed Nov 12, 2026.
- U.S. Geological Survey, "Mineral Commodity Summaries 2025: Platinum-Group Metals" (2025). The 2024 world production estimates and the 2024 value of US output from that edition. pubs.usgs.gov. Accessed Nov 12, 2026.
- U.S. Geological Survey, "Minerals Yearbook 2023: Platinum-Group Metals, tables" (2023 edition). World platinum production for 2019 to 2023 and US trade with Mexico. d9-wret.s3.us-west-2.amazonaws.com. Accessed Nov 12, 2026.
- U.S. Geological Survey, "Mineral Industry Surveys: Platinum-Group Metals, April 2026" (2026). The 2025 average platinum price and the January to April 2026 average and high. d9-wret.s3.us-west-2.amazonaws.com. Accessed Nov 12, 2026.
- U.S. Geological Survey, "Platinum-Group Metals: Historical Statistics (Data Series 140)" (current page). Scope of the historical series. usgs.gov. Accessed Nov 12, 2026.
Chart: our own, with data from USGS, Mineral Commodity Summaries: Platinum-Group Metals (2026) (source 2).
Photo: Smithsonian Institution (CC0, Wikimedia Commons).
fact.mr is not affiliated with consulting firms with similar names.
Found an error? Write to us at [email protected].