Raw materials: what they are, types, examples and how their prices move
What raw materials are, how they are classified, how they differ from commodities and how their prices have moved since 2000, with World Bank data.
In this article
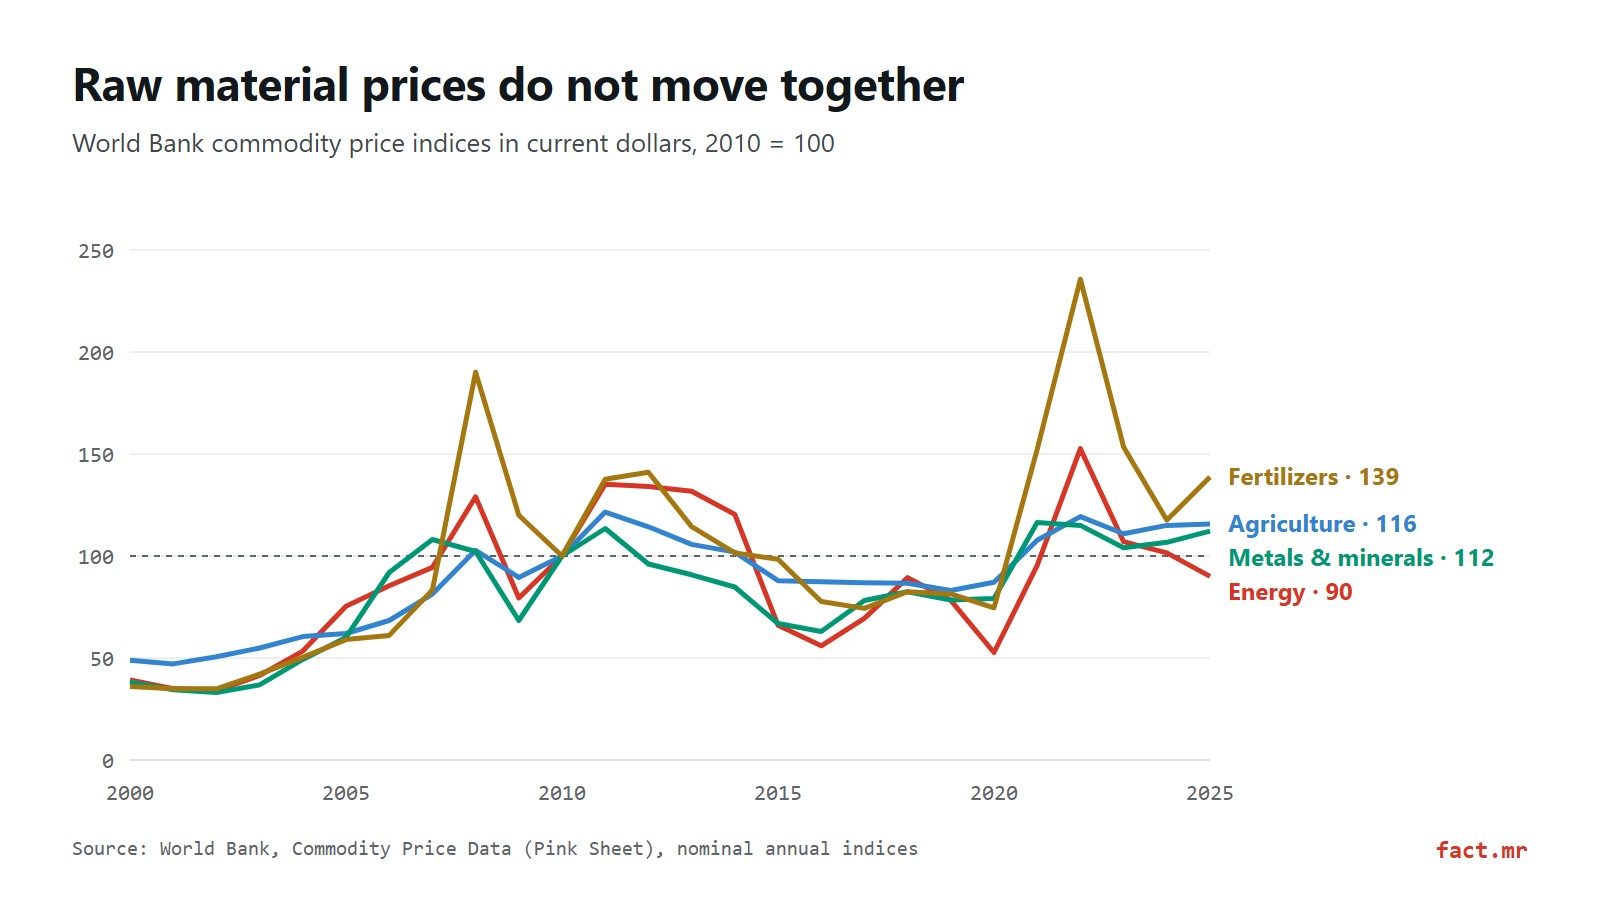
Raw materials are the resources taken from nature to be turned into other goods: the crude oil that gets refined, the wheat that gets milled, the copper that gets smelted. They fall into energy, agricultural products, metals and minerals, and fertilizers, and their prices do not move together. In 2025 the World Bank's energy index stood at 90 (2010 = 100), while its fertilizer index stood at 139.
How we made this article: sources and methodology
Key points
- A raw material is a good that enters a production process and comes out transformed.
- They are classified by origin (plant, animal, mineral, fossil) and by whether they are renewable.
- The World Bank builds its indices from 40 raw materials in four large groups (energy, agriculture, metals and minerals, and fertilizers) plus precious metals separately.
- Crude oil makes up almost 85% of its energy index.
- Prices run in strong cycles: in 2022 energy reached 152.6 and fertilizers 235.7, then fell.
What are raw materials?
A raw material is any good a company buys to transform. Flour is a raw material for a bakery even though it is a finished product for the mill, so it helps to distinguish:
- Raw materials in the strict sense: taken directly from nature, with no prior processing. Examples: crude oil, iron ore, cotton, green coffee.
- Inputs or intermediate materials: already processed once and feeding another process. Examples: steel, flour, plastic resins.
In a company, raw materials are part of direct production cost: what can be assigned to each unit made, together with direct labor.
Types of raw materials
By origin
| Origin | Examples |
|---|---|
| Plant | Wheat, maize, soybeans, coffee, cocoa, cotton, timber, natural rubber |
| Animal | Beef and chicken, milk, wool, leather |
| Mineral | Iron ore, copper, aluminum (bauxite), nickel, phosphate rock, sulfur |
| Fossil | Crude oil, natural gas, coal |
By renewability
- Renewable: they regenerate on human time scales if managed well, such as crops, timber or cotton.
- Non-renewable: they exist in fixed amounts in the Earth's crust or took millions of years to form, such as metals and fossil fuels. Some metals are recycled, which extends their availability.
How the World Bank groups them
Every month the World Bank publishes the "Pink Sheet," its commodity price database. Its indices give a sense of each product's weight, calculated from what developing countries exported in 2002-2004:
| Group | What it includes | Weight within the group |
|---|---|---|
| Energy | Crude oil, natural gas, coal | Oil 84.6%; gas 10.8%; coal 4.7% |
| Agriculture | Food, beverages (coffee, cocoa, tea) and agricultural raw materials (timber, cotton, rubber, tobacco) | 64.9% of the non-energy index |
| Metals and minerals | Aluminum, copper, iron ore, lead, nickel, tin, zinc | 31.6% of the non-energy index; copper weighs the most (12.1 points) |
| Fertilizers | Phosphate rock, phosphates, potassium, nitrogenous | 3.6% of the non-energy index |
| Precious metals (separate) | Gold, silver, platinum | Gold 77.8% |
Raw materials and commodities: are they the same?
Almost, but not quite. A commodity is a standardized raw material, bought and sold on quality rather than brand: a barrel of Brent crude or a ton of maize of a given grade is worth the same wherever it comes from. That is why commodities have public benchmark prices.
Not every raw material is a commodity. A rare mineral sold under private contract, with no published price, is a raw material but not a commodity in the strict sense.
How raw material prices have moved
The chart above shows the World Bank indices in current dollars, with 2010 as the base of 100. Three things stand out:
- The cycles are large. The energy index went from 34 in 2002 to 129 in 2008, fell to 52.7 in 2020 and rose to 152.6 in 2022.
- The groups diverge. In 2025 energy fell to 90, while agriculture (115.7) and metals (112.2) stayed above their 2010 level.
- Fertilizers are the most volatile. Their index reached 190.1 in 2008 and 235.7 in 2022, the two highest peaks on the chart.
Some specific prices, in current dollars:
| Raw material | Unit | 2019 | 2022 | 2025 |
|---|---|---|---|---|
| Brent crude | $/barrel | 64.0 | 99.8 | 69.0 |
| Natural gas, Europe | $/million Btu | 4.80 | 40.34 | 11.96 |
| Copper | $/metric ton | 6,010 | 8,822 | 9,947 |
| Aluminum | $/metric ton | 1,794 | 2,705 | 2,632 |
| Maize | $/metric ton | 170.1 | 318.8 | 203.2 |
| Wheat (US HRW) | $/metric ton | 201.7 | 430.0 | 243.3 |
| Coffee, Arabica | $/kg | 2.88 | 5.63 | 8.47 |
| Urea | $/metric ton | 245.3 | 700.0 | 422.7 |
| Gold | $/troy ounce | 1,392 | 1,801 | 3,442 |
The table shows why talking about "raw materials" as a single block is misleading. Between 2022 and 2025 European gas lost more than two thirds of its price, while Arabica coffee rose 50% and gold 91%.
What moves the price of a raw material?
- Physical supply: harvests, weather, mine closures, supply cuts. European gas in 2022 shows the effect of a cut.
- Industrial demand: construction and manufacturing drive metals; power generation and transport drive energy.
- Linked costs: nitrogen fertilizers are made from natural gas, which is why both indices peaked in 2022.
- The dollar and interest rates: since almost all are priced in dollars, a strong dollar makes them more expensive for the rest of the world.
To see how a raw material works from the inside, read the articles on sulfur, which is barely mined; natural gas, whose price depends on the region; and viscosity, one of the properties that define how a liquid is processed.
Frequently asked questions
What are the most important raw materials in the world?
By weight in the World Bank indices, crude oil dominates energy (84.6% of its index) and copper is the heaviest metal. In agriculture, the heaviest are soybeans and their products (combined), sawnwood, palm oil and maize.
Is water a raw material?
Yes, in many industries it is (food, beverages, chemicals). It is not in the World Bank indices because it has no international benchmark price.
What is the difference between a raw material and a finished product?
It depends on who is buying. Steel is a finished product for the steel mill and a raw material for a carmaker.
Why did fertilizer prices jump in 2022?
The World Bank index reached 235.7 that year, alongside the peak in European natural gas. Nitrogen fertilizers such as urea use natural gas as their main input.
Sources and methodology
Sources
- World Bank, "Commodity Price Data" (Pink Sheet), nominal annual indices and prices, October 2026 release (file updated September 2, 2026). Data for the main chart and the price tables. worldbank.org. Accessed Oct 12, 2026.
- World Bank, "Index Weights" sheet of the same file: weight of each product in the indices, calculated from developing countries' exports in 2002-2004. Accessed Oct 12, 2026.
Methodology
Indices and prices were taken unchanged from the World Bank annual file; they are nominal values (dollars of each year). The 2022-2025 changes (European gas −70%, Arabica coffee +50%, gold +91%) were calculated from those prices. The main chart is our own. The definitions and the classification by origin are general economic concepts and carry no figures. The link between natural gas and nitrogen fertilizers is given as context and is not quantified.
How it was made
Written by fact.mr Editorial. Drafted with the help of AI tools; every figure was checked against the public sources cited. fact.mr is not affiliated with consulting firms with similar names.
Review date
Data reviewed on October 12, 2026. The World Bank updates the series every month. If you find an error, write to [email protected].