US salt industry: what it is, which states produce it, what it is used for and figures
The US produced an estimated 40 million tons of salt in 2025, from 60 plants in 15 states, according to the USGS Mineral Commodity Summaries 2026.
In this article
The US salt industry mines, pumps and evaporates sodium chloride for chemical plants, highway departments and food processors. According to the USGS Mineral Commodity Summaries 2026, domestic production was an estimated 40 million tons in 2025, and 25 companies operated 60 plants in 15 states. The country also imports a large share of what it uses: an estimated 19,000 thousand metric tons in 2025.
Key points
- The US produced an estimated 40 million tons of salt in 2025. Salt sold or used reached an estimated 39 million tons, worth $2.6 billion (USGS).
- Kansas, Louisiana, Michigan, New York, Ohio, Texas and Utah produced about 95% of US salt in 2025.
- By type, salt in brine accounted for 44% of salt sold or used, rock salt for 38%, solar salt for 9% and vacuum pan salt for 9%.
- The chemical industry took about 42% of total salt sales, and highway deicing about 37% of total consumption.
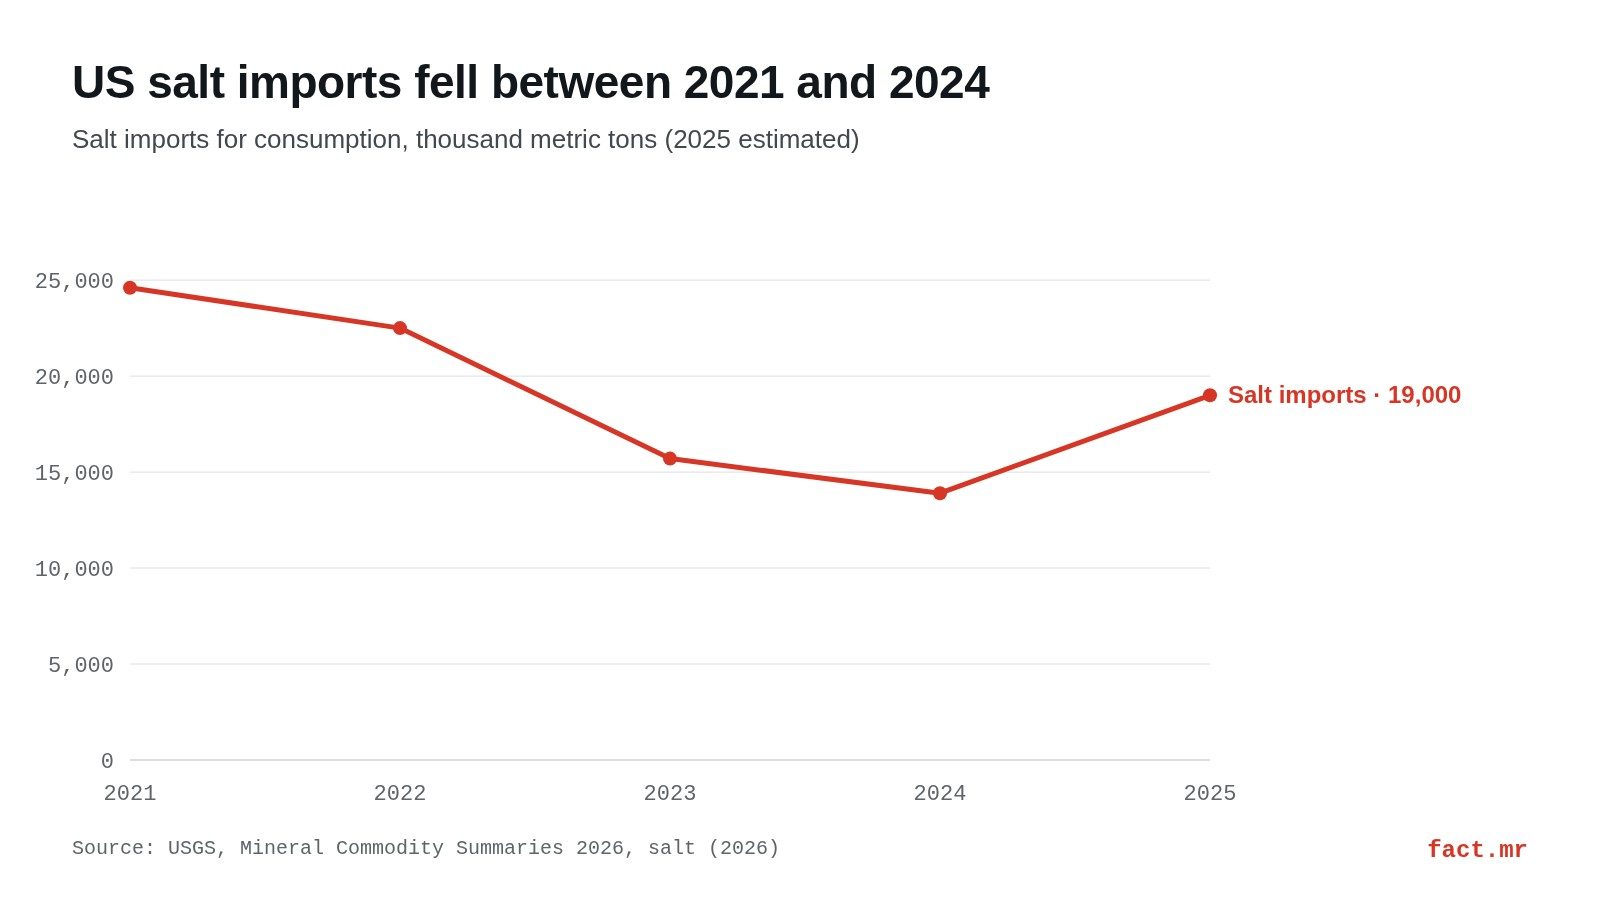
- Imports fell from 24,600 thousand metric tons in 2021 to 13,900 in 2024, then rose to an estimated 19,000 in 2025.
What the US salt industry is
Salt, also known as sodium chloride, has many end uses, and the U.S. Geological Survey names it as a raw material for chlorine and caustic soda.4 Those two chemicals lead to everyday goods: polyvinyl chloride (PVC) plastic is made from chlorine, and paper-pulping chemicals from caustic soda. Salt is the starting point of a long industrial chain, much like the inputs covered in the guide to raw materials types.
The industry is small in headcount. The USGS estimates that mines and plants employed 4,000 people in 2025, after 4,100 in each year from 2022 to 2024.1 The number of producers shrank a little: the 2025 edition counted 26 companies with 64 plants in 16 states for 2024, against 25 companies, 60 plants and 15 states a year later.2
These numbers come from a long-running federal survey. The government began compiling mineral statistics at the request of the 47th Congress (1882; 22 Stat. 329), and today the USGS collects data from more than 18,000 producer and consumer establishments that fill out about 40,000 forms.6
Where salt is produced in the US
Seven states dominate. Kansas, Louisiana, Michigan, New York, Ohio, Texas and Utah produced about 95% of the salt in the United States in 2025, according to the Mineral Commodity Summaries 2026.1
The 2023 Minerals Yearbook tables break down salt sold or used for five of those states. Louisiana leads by tonnage by a wide margin.
| State | 2022, quantity (thousand metric tons) | 2022, value (thousand dollars) | 2023, quantity (thousand metric tons) | 2023, value (thousand dollars) |
|---|---|---|---|---|
| Louisiana | 13,700 | 357,000 | 13,600 | 330,000 |
| Texas | 6,720 | 176,000 | 6,850 | 185,000 |
| New York | 6,270 | 521,000 | 4,470 | 468,000 |
| Utah | 2,060 | 311,000 | 2,930 | 389,000 |
| Kansas | 2,760 | 237,000 | 2,820 | 246,000 |
Source: USGS, 2023 Minerals Yearbook, salt tables.3
Look at New York. It sold 4,470 thousand metric tons in 2023 against Louisiana's 13,600, yet its salt was worth 468,000 thousand dollars against Louisiana's 330,000. The table doesn't say which types of salt each state sold, so the gap can't be split by product. Michigan and Ohio, also in the top seven, are not in this comparison.
Types of salt: brine, rock, solar and vacuum pan
US salt comes out of the ground or the sea in four commercial forms. Brine is salt dissolved in water. Rock salt is mined as a solid, solar salt is evaporated by sun and wind, and vacuum pan salt is crystallized from brine in evaporators.
In 2025, salt in brine made up 44% of salt sold or used, rock salt 38%, solar salt 9% and vacuum pan salt 9%, according to the USGS.1
Production by type
| Year | Total production (thousand metric tons) | Rock salt | Brine |
|---|---|---|---|
| 2019 | 44,800 | 19,100 | 17,900 |
| 2020 | 42,600 | 18,200 | 16,400 |
| 2021 | 39,300 | 17,500 | 14,500 |
| 2022 | 39,400 | 15,700 | 16,700 |
| 2023 | 39,800 | 14,600 | 17,400 |
Source: USGS, 2023 Minerals Yearbook, salt tables (excludes Puerto Rico).3
Rock salt was 36.7% of total production in 2023, down from 19,100 thousand metric tons in 2019 to 14,600. The later Mineral Commodity Summaries put total production at 40,400 thousand metric tons in 2024 and 40,000 in 2025 (estimated).1 Installed capacity in 2023, measured in thousand short tons (a different unit from the rest of the series, so don't mix them), was 24,000 for rock salt, 14,500 for brine, 5,610 for vacuum and open pan salt, and 5,320 for solar salt.3
Prices by type
The price gap between forms of salt is huge. The USGS reports average unit values f.o.b. mine and plant, in dollars per metric ton:
| Type | 2021 | 2022 | 2023 | 2024 | 2025 |
|---|---|---|---|---|---|
| Vacuum and open pan salt | 203.72 | 217.58 | 238.51 | 259.69 | 260 |
| Solar salt | 153.52 | 128.87 | 142.80 | 152.87 | 150 |
| Rock salt | 59.88 | 56.86 | 52.28 | 52.95 | 54 |
| Salt in brine | 8.14 | 9.11 | 10.20 | 10.56 | 11 |
Source: USGS, Mineral Commodity Summaries 2026.1
Across all types, salt sold or used in 2023 averaged $61.07 per metric ton (39,300 thousand metric tons worth 2,400,000 thousand dollars, per the Minerals Yearbook).3 Brine is the largest category by volume and by far the cheapest per ton.
What salt is used for in the US
Chemical plants are the biggest buyers. The chemical industry accounted for about 42% of total salt sales in 2025, and salt in brine made up approximately 90% of the salt used as chemical feedstock.1 Chlorine and caustic soda manufacturers were the main consumers within that group (the same chlorine that goes into PVC plastic, covered in the guide to the seven plastic resin codes).
Roads come second. Highway deicing accounted for about 37% of total salt consumed in 2025, down from about 41% in 2024.12
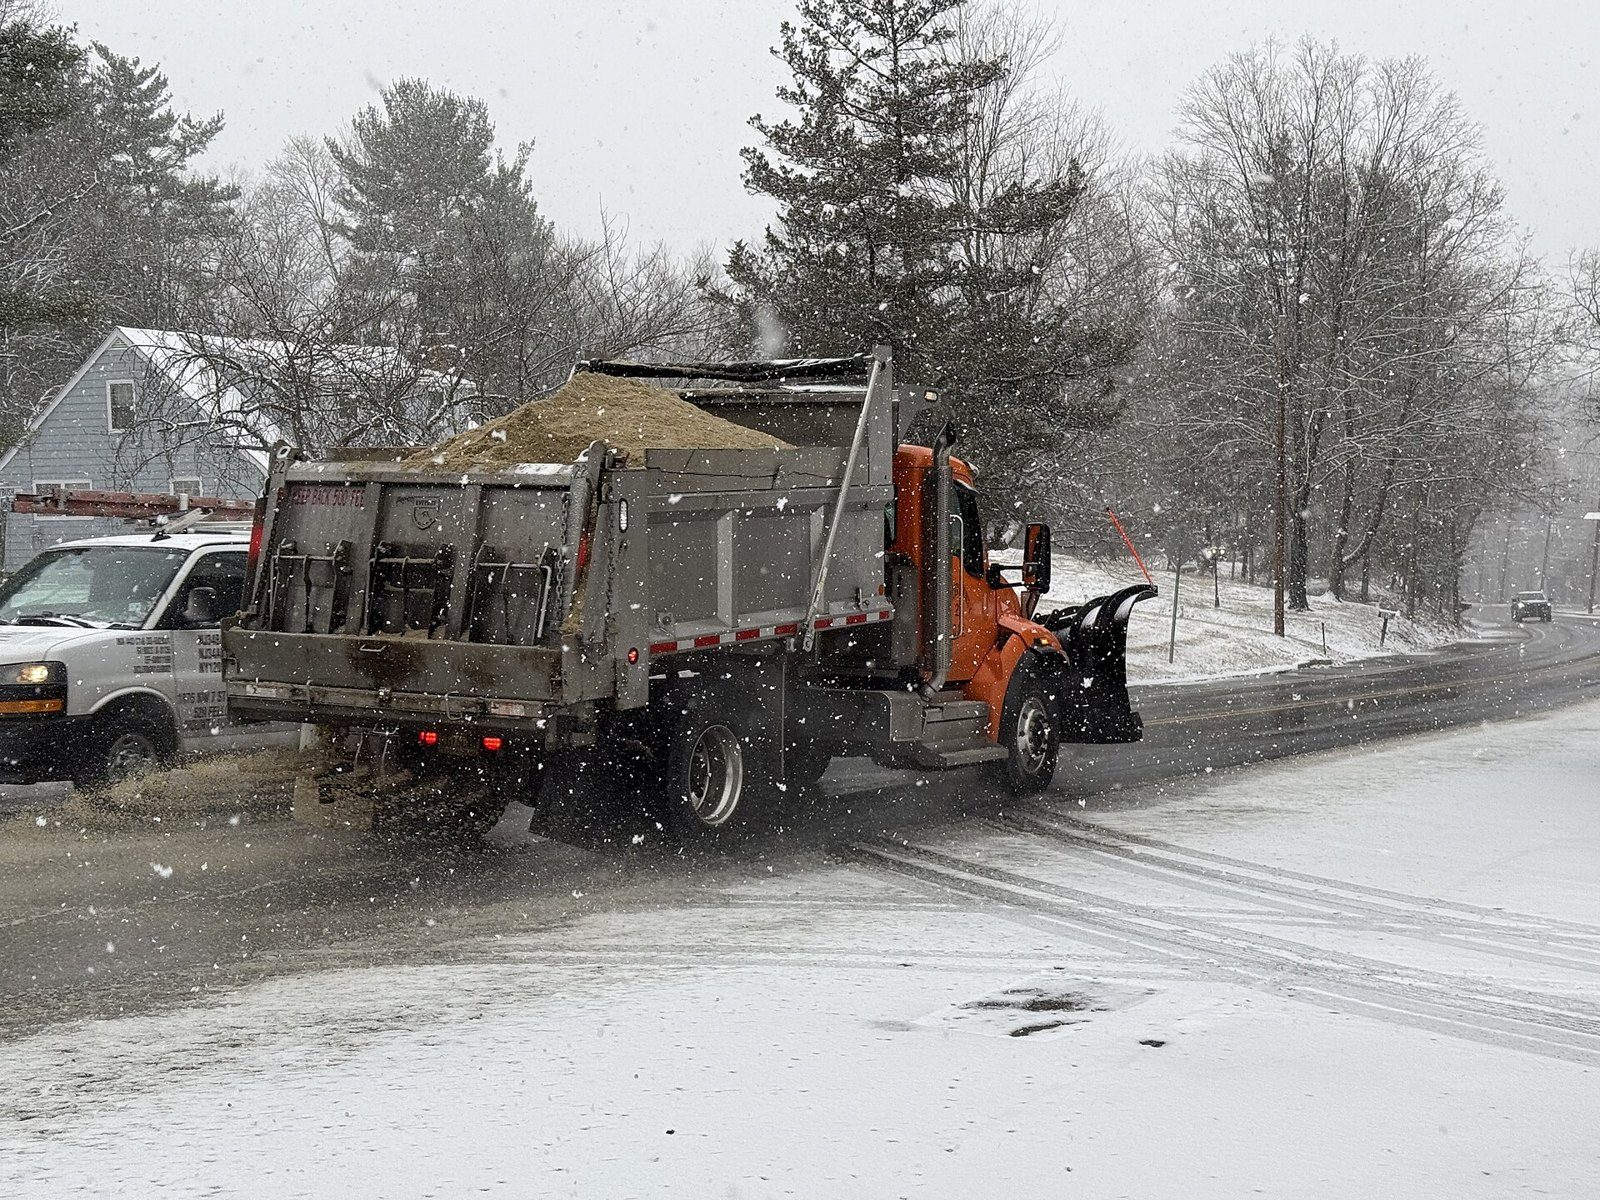
For road salt, the USGS says the number of winter weather events (freezing rain, sleet and snow) predicts demand for rock salt better than total snowfall does. That matters to any public works department budgeting for a season. In early 2025 a regional rock salt shortage affected New York, which the USGS attributes to strong demand during severe weather combined with limited supply.1
The Mineral Commodity Summaries 2025 listed the remaining markets for 2024, after the chemical industry, this way:
| Market (2024) | Share of salt consumed |
|---|---|
| Highway deicing | about 41% |
| Distributors | 9% |
| Food processing | 4% |
| Agricultural | 3% |
| General industrial | 2% |
| Primary water treatment | 1% |
| Miscellaneous | 1% |
Source: USGS, Mineral Commodity Summaries 2025.2
Can anything replace salt? For most applications, no economic substitutes exist, according to the USGS. Calcium chloride, calcium magnesium acetate, hydrochloric acid and potassium chloride can stand in for some uses, at a higher cost.1
Imports, exports and apparent consumption
The US buys far more salt abroad than it sells. The USGS measures this with apparent consumption, defined for salt as salt sold or used by producers plus imports minus exports.1
| Year | Imports for consumption (thousand metric tons) | Exports | Apparent consumption | Net import reliance (% of apparent consumption) |
|---|---|---|---|---|
| 2021 | 24,600 | 1,010 | 63,400 | 37% |
| 2022 | 22,500 | 886 | 62,300 | 35% |
| 2023 | 15,700 | 2,260 | 53,200 | 25% |
| 2024 | 13,900 | 2,060 | 51,300 | 23% |
| 2025 (est.) | 19,000 | 1,500 | 57,000 | 31% |
Source: USGS, Mineral Commodity Summaries 2026.1
Imports fell 43.5% between 2021 and 2024. Why did a country with vast deposits rely on net imports for 37% of its apparent consumption in 2021, and 23% in 2024? The 2026 edition gives no cause for the swing in imports. It does say consumption rose in 2025 from recent years, primarily owing to demand for road salt and the chloralkali markets.1
Suppliers changed order too. In 2021 to 2024, Mexico supplied 26% of imports, Chile 23%, Canada 21%, Egypt 6% and other countries 24%. In the previous window, 2020 to 2023, Canada led with 29%, followed by Chile with 27%, Mexico with 14% and Egypt with 8%.12
Salt (sodium chloride, HTS 2501.00.0000) entered free of duty under Normal Trade Relations as of Dec 31, 2025. The depletion allowance is 10% for domestic and foreign deposits, and there is no government stockpile.1
US salt production compared with the world
The USGS estimates world mine production at 270,000 thousand metric tons in 2025. With 40,000, the US accounted for 14.8%, behind China and ahead of India.1
| Country | 2024 (thousand metric tons) | 2025 (est.) |
|---|---|---|
| China | 56,000 | 56,000 |
| United States | 40,400 | 40,000 |
| India | 34,000 | 30,000 |
| Germany | 15,000 | 15,000 |
| Australia | 12,000 | 12,000 |
| Mexico | 7,000 | 7,000 |
| World total (rounded) | 275,000 | 270,000 |
Source: USGS, Mineral Commodity Summaries 2026.1
The two most recent editions disagree on 2024. The 2025 edition put world output at 280,000 thousand metric tons, while the 2026 edition says 275,000 after significant revisions to Chile, India, Iran, Italy, Mexico and Poland based on company and government reports.12 Supply is not the constraint. World continental resources of salt are vast, and the salt content of the oceans is nearly unlimited, according to the USGS. The same pattern of a few dominant producers shows up in other minerals, such as sulfur.
Terms that get confused
- Production vs. sold or used. Production counts salt taken from deposits; sold or used counts what producers shipped or consumed themselves. In 2025 the USGS estimated 40 million tons of the first and 39 million tons of the second.1
- Apparent consumption. The general USGS formula is production plus imports minus exports, plus or minus stock changes.6 The salt chapter uses sold or used instead of production.
- Metric tons vs. short tons. Most USGS salt tables are in metric tons. The capacity table is in short tons.
- Salt mining vs. NAICS 212. The Bureau of Labor Statistics groups salt with all mining except oil and gas. That sector had 7,416 private establishments in the first quarter of 2026 (preliminary) and 189.6 thousand employees in September 2026 (preliminary, seasonally adjusted); neither number is salt-only.7
But the outlook in the latest summary is muted: global demand for brine for chloralkali was expected to rise in 2026, while domestic demand was anticipated to remain largely flat.1
Frequently asked questions
How much salt does the US produce?
The USGS Mineral Commodity Summaries 2026 estimates domestic production at 40 million tons in 2025, after 40,400 thousand metric tons in 2024. In 2025, 25 companies operated 60 plants in 15 states, and salt sold or used reached an estimated 39 million tons with a total value of $2.6 billion.
Which state produces the most salt?
Louisiana leads by volume. According to the USGS 2023 Minerals Yearbook, it sold or used 13,600 thousand metric tons in 2023, ahead of Texas with 6,850 and New York with 4,470. New York's salt had the highest value of the three, at 468,000 thousand dollars.
Where does the US import salt from?
From 2021 to 2024, Mexico supplied 26% of US salt imports, Chile 23%, Canada 21% and Egypt 6%, according to the USGS. In the 2020 to 2023 window, Canada led with 29%. Salt under HTS 2501.00.0000 entered duty-free under Normal Trade Relations as of December 31, 2025.
How much salt goes on US roads?
Highway deicing accounted for about 37% of total salt consumed in 2025, down from about 41% in 2024, according to the USGS. The agency notes that the number of winter weather events, such as freezing rain, sleet and snow, predicts rock salt demand better than total snowfall.
Sources
- U.S. Geological Survey, "Salt," Mineral Commodity Summaries 2026 (2026). Production, salt sold or used, companies and plants, top states, types, uses, imports, exports, apparent consumption, prices, employment, tariff, world production and outlook. pubs.usgs.gov. Accessed Oct 29, 2026.
- U.S. Geological Survey, "Salt," Mineral Commodity Summaries 2025 (2025). Companies and plants in 2024, deicing share and other markets in 2024, import sources for 2020 to 2023, world production for 2023 and 2024. pubs.usgs.gov. Accessed Oct 29, 2026.
- U.S. Geological Survey, "Salt," 2023 Minerals Yearbook, tables (xlsx). Production by type for 2019 to 2023, salt sold or used and its value, salt by state, production capacity. d9-wret.s3.us-west-2.amazonaws.com. Accessed Oct 29, 2026.
- U.S. Geological Survey, National Minerals Information Center, "Salt Statistics and Information." Definition of salt, chlorine and caustic soda, PVC and paper-pulping chemicals. usgs.gov. Accessed Oct 29, 2026.
- U.S. Geological Survey, "Mineral commodity summaries 2026," publication page (published Feb 6, 2026; version 1.3, May 2026; 222 pages; more than 90 minerals and materials). pubs.usgs.gov. Accessed Oct 29, 2026.
- U.S. Geological Survey, National Minerals Information Center, "Historical Statistics on Mineral Commodities in the United States." Apparent consumption formula, survey coverage, 1882 origin of federal mineral statistics. usgs.gov. Accessed Oct 29, 2026.
- U.S. Bureau of Labor Statistics, "Mining (except Oil and Gas): NAICS 212." Establishments and employment for the sector. bls.gov. Accessed Oct 29, 2026.
Chart: our own, with data from USGS, Mineral Commodity Summaries 2026, salt (source 1).
Photo: Famartin (CC BY-SA 4.0, Wikimedia Commons).
fact.mr is not affiliated with consulting firms with similar names.
Found an error? Write to us at [email protected].