Nickel: what it is used for, where it comes from and which countries produce it
Nickel production by country: Indonesia mined 2,600,000 tons in 2025 of a 3.9 million-ton world total, per the USGS. Uses, nickel sulfate, US imports and prices.
In this article
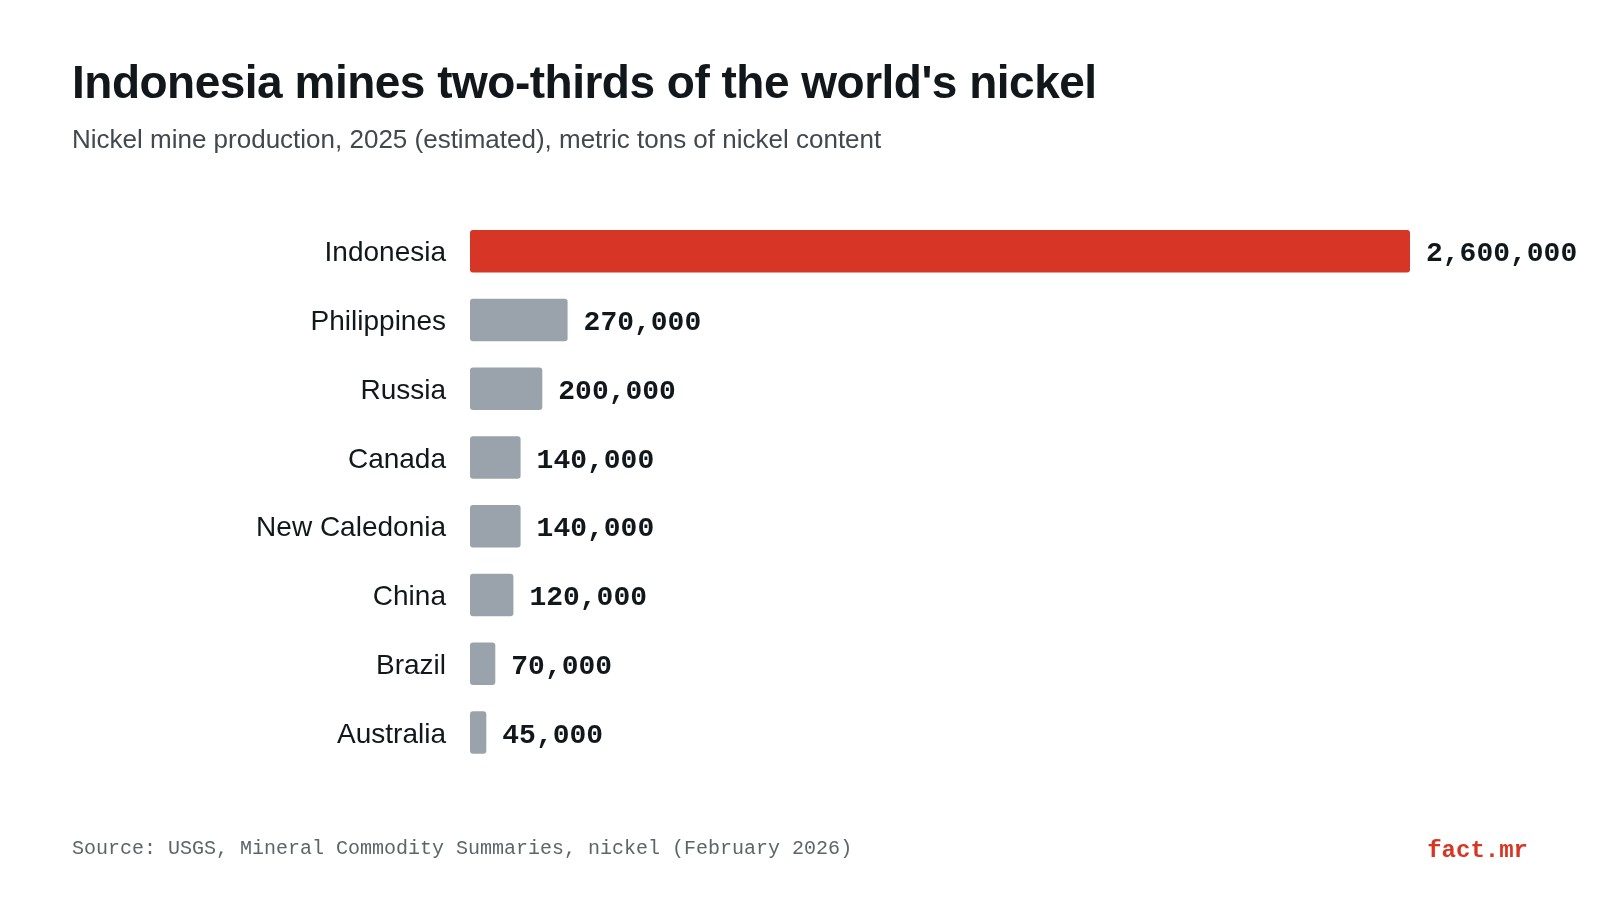
Indonesia mines most of the world's nickel. The U.S. Geological Survey (USGS) estimates global mine production at 3.9 million tons in 2025, and Indonesia alone accounted for 2,600,000 tons, well ahead of the Philippines, Russia, Canada and New Caledonia. Most of it, at least in the Western World, ends up in stainless steel.
Key points
- World nickel mine production reached an estimated 3.9 million tons in 2025, up 5% according to the USGS.
- Indonesia mined 2,600,000 tons in 2025, or 66.7% of the estimated world total.
- About 65% of the nickel consumed in the Western World goes into austenitic stainless steel; rechargeable batteries fall inside a 23% group of smaller uses.
- The United States mined about 10,000 tons in 2025 and had a net import reliance of 41% of apparent consumption.
- The London Metal Exchange (LME) annual average cash price was an estimated $15,000 per metric ton in 2025, 11% lower than in 2024.
What nickel is
Its chemical symbol is Ni. The USGS National Minerals Information Center describes it as a transition element with a mix of ferrous and nonferrous metal properties. Like other mineral raw materials, it goes through several stages between the mine and the factory floor.
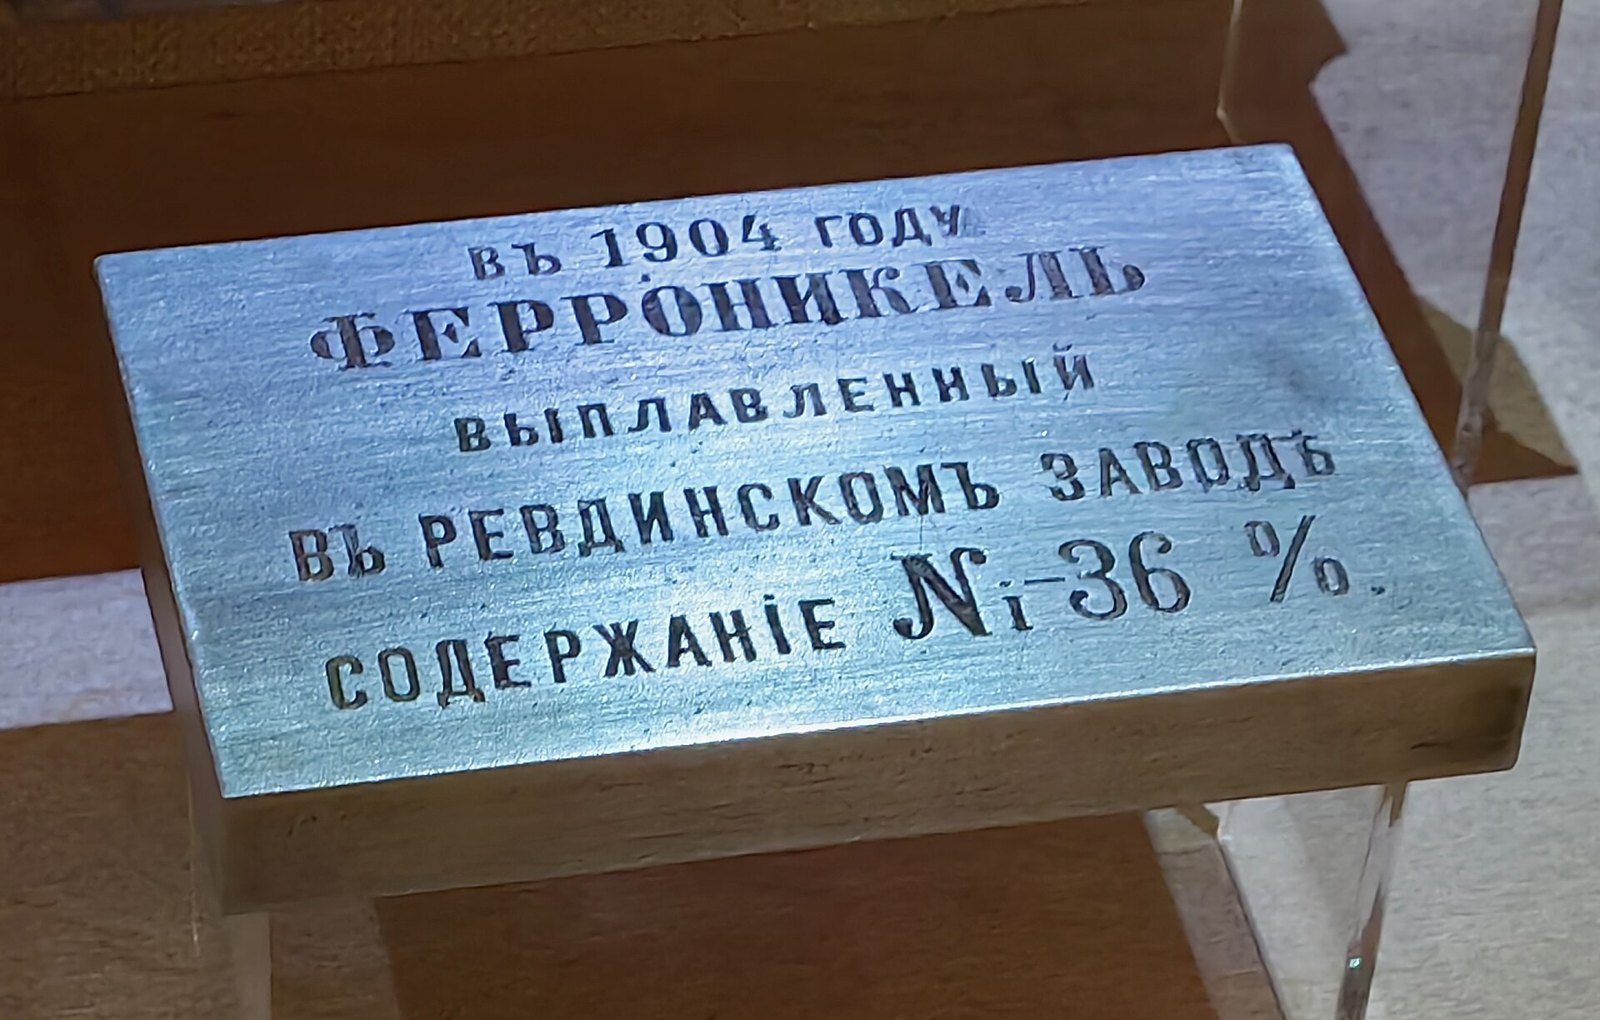
Manufacturers rarely buy it as ore. For first use, nickel is sold mainly as refined metal (cathode, powder, briquet) or as ferronickel.
Every production figure here is in metric tons of nickel content, the unit the USGS uses in its summary. That counts the metal inside the ore, not the weight of the rock dug out (and they are metric tons, not the short tons common in US trade talk).
Where it comes from: laterites and sulfides
Two kinds of ore deposit supply the bulk of mined nickel, according to the USGS. Laterites carry nickeliferous limonite and garnierite, while magmatic sulfide deposits carry pentlandite.
Known resources split along the same line. The February 2026 Mineral Commodity Summaries places 54% of them in laterites and 35% in magmatic sulfide deposits, and the USGS country profile records Indonesia's output as laterite ore.
Nickel production by country
The USGS Mineral Commodity Summaries, released in February 2026, gives mine output for 2024 and an estimate for 2025. The annual report covers 5-year statistics for over 90 minerals and materials, from sulfur to rare earth elements, and the USGS calls it the earliest government publication with estimates for the nonfuel mineral industry.
| Country | 2024 (tons) | 2025, estimated (tons) |
|---|---|---|
| Indonesia | 2,310,000 | 2,600,000 |
| Philippines | 354,000 | 270,000 |
| Russia | 205,000 | 200,000 |
| Canada | 125,000 | 140,000 |
| New Caledonia (French overseas territory) | 116,000 | 140,000 |
| China | 115,000 (estimated) | 120,000 |
| Brazil | 67,500 | 70,000 |
| Australia | 98,000 | 45,000 |
| United States | 7,490 | 10,000 |
| Other countries | 308,000 | 290,000 |
| World total (rounded) | 3,710,000 | 3,900,000 |
On those numbers, Indonesia held 66.7% of estimated world output in 2025, up from 62.3% in 2024. The USGS text puts world growth at 5%; working from the rounded table totals gives 5.1%.
Indonesia: from 767,000 to 2,600,000 tons
The USGS country profile tracks the climb year by year.
| Year | Indonesia mine production (tons of nickel content) |
|---|---|
| 2020 | 767,000 |
| 2021 | 1,069,000 |
| 2022 | 1,579,000 |
| 2023 | 2,030,000 |
| 2024 | 2,310,000 (estimated) |
For 2025 the nickel summary estimates a 13% increase and credits new operations that kept ramping up production. Back in 2020, Indonesia's Ministry of Energy and Mineral Resources had banned exports of nickel ore to encourage domestic plants and value-added products.
One of those products is nickel pig iron (NPI), estimated at 11 million tons in 2024 against 9.9 million in 2023. That is gross weight, not nickel content (so it does not belong in the same sum as the country table).
Australia and the Philippines moved the other way
Australia fell from 98,000 tons in 2024 to 45,000 in 2025, an estimated 54% drop that the USGS ties to several companies placing mines on care-and-maintenance status because of low prices. The Philippines slid 24%, from 354,000 to 270,000 tons, after multiple mines reported production cuts.
The Philippine province of Palawan announced a 50-year ban on new mining permits, which left existing operations untouched.
Figures shift between editions
The 2025 edition put 2024 world output at 3,700,000 tons and Indonesia at 2,200,000; the 2026 edition revised them to 3,710,000 and 2,310,000. The only change the USGS calls significant is Canada, cut from 190,000 tons to 125,000 based on a government report.
But the 2025 numbers are estimates too, and the next edition can move them.
What nickel is used for
Stainless steel takes most of it. The USGS says about 65% of the nickel consumed in the Western World goes into austenitic stainless steel, another 12% into superalloys and nonferrous alloys, and the remaining 23% is spread across a long list of uses.
| End use | Share of consumption |
|---|---|
| Austenitic stainless steel | About 65% |
| Superalloys (for example, Inconel 600) and nonferrous alloys (for example, cupronickel) | 12% |
| Alloy steels, rechargeable batteries, catalysts and other chemicals, coinage, foundry products and plating | 23% |
The split has limits: it covers only the "Western World," and the USGS does not say which year it describes.
Inside the United States the picture looks similar. Stainless and alloy steel plus nickel-containing alloys typically account for more than 85% of domestic consumption, and the USGS lists alloys and steels, electroplating, and catalysts and chemicals as the leading uses of primary nickel.
Superalloys and jet engines
Turbine blades, discs and other critical jet engine parts are made from nickel-base superalloys. For corrosive environments, the USGS names titanium alloys as a possible substitute for nickel or nickel-base alloys.
Nickel sulfate and batteries
Nickel sulfate (NiSO4) is one of the principal commercial nickel chemicals, alongside the carbonate (NiCO3), the chloride (NiCl2) and the divalent oxide (NiO). Rechargeable batteries sit inside the 23% group of smaller uses.
So how much nickel actually ends up in batteries? The USGS does not break it out: batteries share a line with alloy steels, catalysts, coinage, foundry products and plating, and there is no separate figure for sulfate headed to battery cells.
The United States: a small miner that relies on imports
The underground Eagle Mine in Michigan produced approximately 10,000 tons of nickel in concentrate in 2025, which was exported to smelters in Canada and other countries. That is 0.26% of world output. The last US primary nickel refinery, the Port Nickel facility in Louisiana, ceased operations in 1985.
In 2025 the country imported an estimated 100,000 tons of primary nickel and 45,000 tons of secondary nickel (scrap), against total apparent consumption of 220,000 tons, according to the USGS. Net import reliance came to 41% of apparent consumption. Excluding scrap, it would be nearly 100%.
Scrap carries real weight here: nickel recovered from it made up approximately 60% of apparent consumption in 2025. And Mexico supplied 27% of the nickel-bearing scrap the United States imported from 2021 to 2024, second only to Canada.
| Source (2021 to 2024) | Primary nickel | Nickel-bearing scrap |
|---|---|---|
| Canada | 44% | 41% |
| Mexico | Not listed separately | 27% |
| Norway | 11% | Not listed separately |
| United Kingdom | Not listed separately | 9% |
| Australia | 8% | Not listed separately |
| Brazil | 7% | Not listed separately |
| Other | 30% | 23% |
The scrap column includes the nickel contained in stainless steel scrap. As of December 31, 2025, unwrought nickel, not alloyed (HTS 7502.10.0000), entered duty-free at the normal trade relations rate.
Nickel price
The benchmark is set on the London Metal Exchange. The USGS estimates the annual average cash price at $15,000 per metric ton in 2025 ($6.90 per pound), 11% below 2024.
| Year | LME annual average cash price (dollars per metric ton) |
|---|---|
| 2021 | 18,476 |
| 2022 | 25,815 |
| 2023 | 21,495 |
| 2024 | 16,812 |
| 2025 (estimated) | 15,000 |
The World Bank publishes a separate annual series in its Pink Sheet: LME nickel cathodes with a minimum 99.8% purity, using the settlement price since 2005 and the cash price before that, in nominal US dollars per metric ton. Its averages should not be mixed with the USGS figures.
The International Nickel Study Group (INSG) estimated a surplus in the global primary nickel balance (production minus consumption) of 98,500 tons in 2022, 170,000 in 2023 and 182,000 in 2024. Through the first 9 months of 2025 the estimated surplus was 189,000 tons, compared with 107,000 in the same stretch of 2024.
Could the world run out of nickel?
The 2026 USGS edition puts world reserves at more than 140,000,000 tons. Indonesia holds 62,000,000 of them.
| Country | Reserves (tons of nickel content) |
|---|---|
| Indonesia | 62,000,000 |
| Brazil | 16,000,000 |
| Russia | 8,300,000 |
| United States | 340,000 |
| World total (rounded) | More than 140,000,000 |
Reserves for Australia, Indonesia and the United States were revised in that edition using company and government reports. Beyond reserves, the USGS estimates resources containing more than 350 million tons of nickel.
Then comes the seabed. A 2022 USGS study estimated that ocean-floor deposits hold approximately 4.5 billion tons of nickel, a figure the summary does not assign to any country.
Frequently asked questions
Which country produces the most nickel?
Indonesia, with an estimated 2,600,000 tons in 2025 out of a world total of 3.9 million, according to the USGS. The Philippines followed with 270,000, Russia with 200,000, and Canada and New Caledonia with 140,000 each. The USGS country profile already ranked Indonesia first in 2024, with 62% of global production.
What is nickel used for?
Mostly stainless steel: about 65% of the nickel consumed in the Western World goes into austenitic stainless steel, per the USGS. Another 12% goes into superalloys, such as those in jet engines, and alloys like cupronickel. The rest covers rechargeable batteries, catalysts, coinage and plating, among other uses.
What is nickel sulfate?
Nickel sulfate (NiSO4) is one of the principal commercial nickel chemicals, along with the carbonate, the chloride and the divalent oxide, according to the USGS National Minerals Information Center. The agency places rechargeable batteries within the 23% group of smaller nickel uses and gives no separate figure for sulfate.
How much does nickel cost?
The USGS estimates the LME annual average cash price at $15,000 per metric ton in 2025, or $6.90 per pound. That was 11% below 2024, when it averaged $16,812, and far from the $25,815 of 2022.
Sources
- U.S. Geological Survey, "Mineral Commodity Summaries: Nickel" (February 2026). Production and reserves by country for 2024 and 2025, changes by country, revisions, US uses and imports, LME price, INSG balance, resources, seabed deposits and substitutes. pubs.usgs.gov. Accessed Oct 23, 2026.
- U.S. Geological Survey, "Mineral Commodity Summaries: Nickel" (2025 edition). Earlier estimates of 2024 production for the world, Indonesia, Canada and the United States. pubs.usgs.gov. Accessed Oct 23, 2026.
- U.S. Geological Survey, National Minerals Information Center, "Nickel Statistics and Information." Definition of nickel, deposit types, forms of sale, end-use split, superalloys and principal commercial chemicals. usgs.gov. Accessed Oct 23, 2026.
- U.S. Geological Survey, National Minerals Information Center, "Indonesia." Nickel mine production series, 2024 world share, ore export ban and nickel pig iron output. usgs.gov. Accessed Oct 23, 2026.
- U.S. Geological Survey, National Minerals Information Center, "Mineral Commodity Summaries." Description, frequency and coverage of the publication. usgs.gov. Accessed Oct 23, 2026.
- World Bank, "CMO Historical Data Annual" (Pink Sheet, current edition). Definition and unit of the annual nickel price series. thedocs.worldbank.org. Accessed Oct 23, 2026.
Chart: our own, with data from USGS, Mineral Commodity Summaries, nickel (source 1).
Photo: Александр Сигачёв (CC0, Wikimedia Commons).
fact.mr is not affiliated with consulting firms with similar names.
Found an error? Write to us at [email protected].