Polymers: what they are, types, examples and figures
A polymer is a long molecule built from repeating units. Global resin and fiber output rose from 2 Mt in 1950 to 380 Mt in 2015, per Geyer et al.
In this article
A polymer is a very large molecule built from many small repeating units, called monomers, joined into long chains or networks. Plastics are the most familiar example: a 2017 study by Geyer et al. in Science Advances describes them as synthetic organic polymers and found that global production of resins and fibers grew from 2 Mt in 1950 to 380 Mt in 2015.1 Polymers are grouped by how they respond to heat: thermoplastics, thermosets and elastomers.
Key points
- A polymer is a long chain of repeating monomers. Plastics are synthetic organic polymers, mixed with additives.
- Thermoplastics soften when heated and can be remelted. Thermosets cure into a crosslinked network that does not melt. Elastomers are lightly crosslinked, so they stretch and spring back.
- Polyethylene (PE, 36%), polypropylene (PP, 21%) and PVC (12%) are the largest groups in nonfiber plastics production, according to Geyer et al.
- Resins and fibers made from 1950 through 2015 total 7,800 Mt, and half of that came in the last 13 years of the period.
- In the United States, plastics generated in municipal solid waste rose from 390 thousand tons in 1960 to 35,680 thousand tons in 2018, according to the EPA.
What a polymer is, in plain terms
The name comes from Greek: poly, "many," and meros, "part." Picture a string of beads where every bead is the same small molecule. Snap enough beads together and the string starts to behave like a different material from the loose beads.
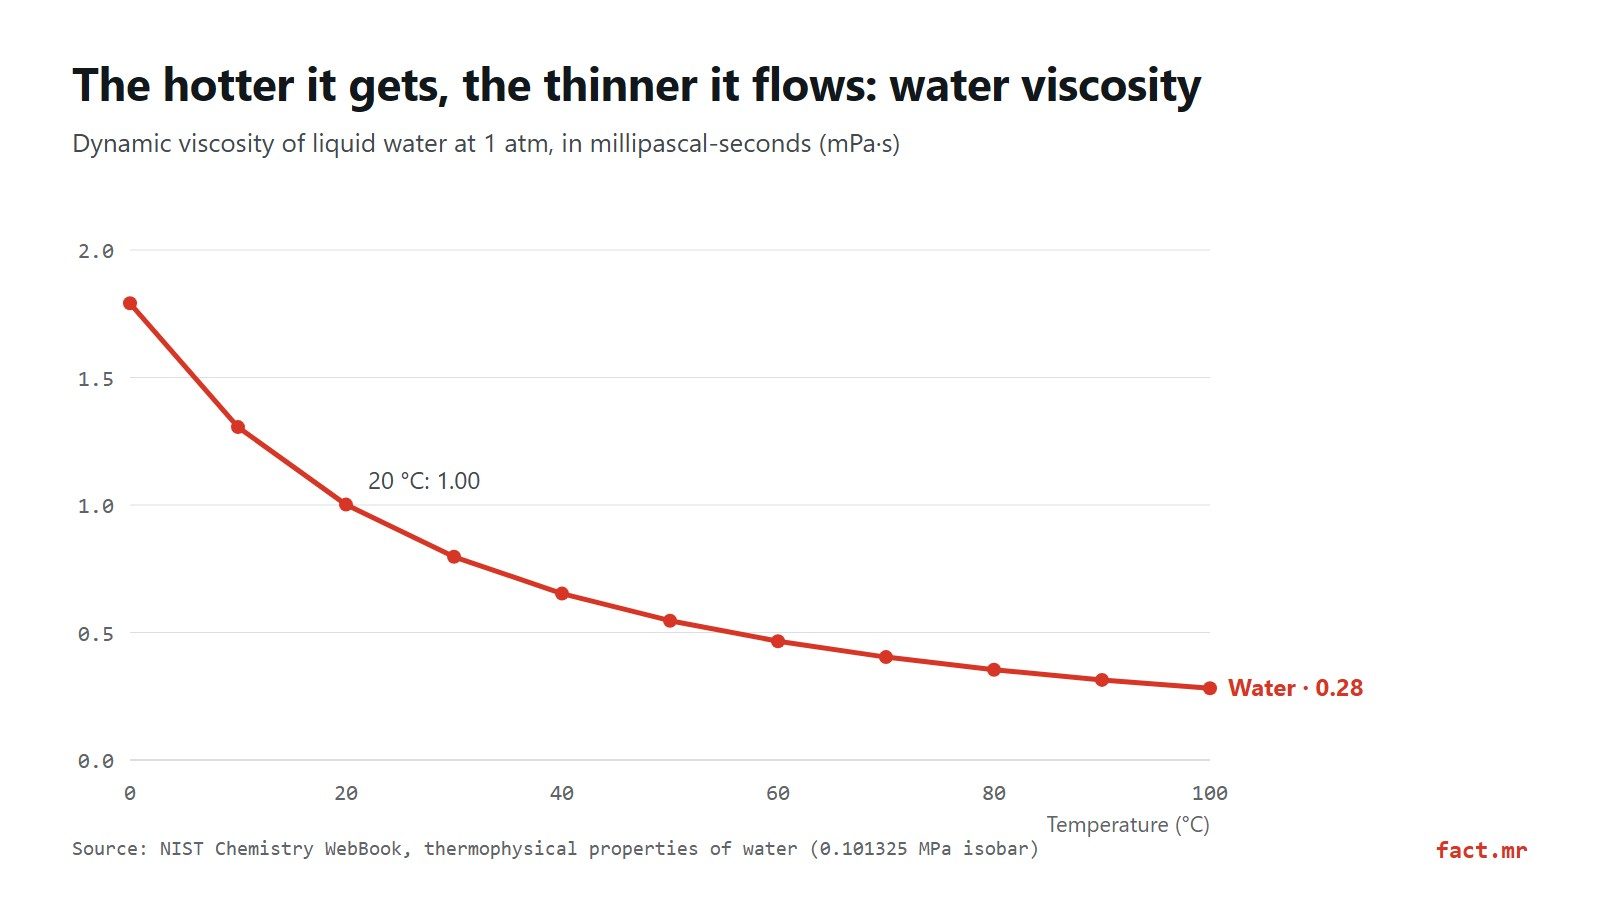
Take ethylene. It is a gas, and its molecule is tiny. Link a very large number of ethylene molecules end to end and you get polyethylene, the waxy solid in milk jugs and grocery bags. Long chains also tangle, which is why molten plastics flow so thickly (see viscosity explained for how that thickness is measured).
Nature made polymers long before chemists did. Cellulose in wood and cotton, proteins, DNA and natural rubber are all polymers. The synthetic ones are newer: the first synthetic plastics, such as Bakelite, appeared in the early twentieth century, and large-scale production and use only dates back to about 1950, according to Geyer et al.1
Types of polymers: thermoplastics, thermosets and elastomers
For engineers and buyers, the split that matters is what happens when the material gets hot. Some polymers melt and can be molded again. Others burn before they ever flow.
| Family | What heat does | Chain structure | Common examples |
|---|---|---|---|
| Thermoplastics | Softens and melts; can be reshaped and remelted | Separate chains with no chemical crosslinks | PE, PP, PVC, PS, PET |
| Thermosets | Cures once into a hard solid; reheating chars it instead of melting it | Dense three-dimensional network of crosslinks | Epoxy, phenolic resins such as Bakelite, rigid polyurethanes |
| Elastomers | Stays rubbery over its working range; most do not remelt | Chains with light crosslinking that lets them stretch and recover | Natural rubber, silicone rubber, polyurethane elastomers |
Geyer et al. list the families in their analysis as thermoplastics, thermosets, polyurethanes (PUR), elastomers, coatings and sealants.1 PUR shows how blurry the boundaries can be: the same chemistry can end up as a soft foam, a rigid insulation board or a rubbery part (one family name, several personalities).
Why heat separates them: crosslinking
In a thermoplastic, only weak attractions and physical tangling hold the chains together. Heat loosens those attractions, the chains slide past one another, and the solid flows. Cool it and it sets again, which is what injection molding and bottle blowing rely on.
Epoxy behaves very differently. Curing ties its chains to one another with covalent bonds and builds one continuous network, and once that network has formed, heating cannot undo it.
Why can a milk jug be ground up and molded again, while the epoxy board inside a phone cannot?
The answer is in those crosslinks. Elastomers sit in between: their chains carry a few crosslinks, enough to pull the material back into shape after stretching. But there are few enough of them that the chains can uncoil and stretch in the first place.
Polymer examples: PE, PP, PVC and the other big resins
A short list of resins makes up most of what gets produced. Geyer et al. name high-density polyethylene, low-density and linear low-density polyethylene, polypropylene (PP), polystyrene (PS), polyvinyl chloride (PVC), polyethylene terephthalate (PET) and PUR resins, and together these groups account for 92% of all plastics ever made.1
| Polymer | Family | Share of production | Typical uses |
|---|---|---|---|
| Polyethylene (PE) | Thermoplastic | 36% of nonfiber plastics | Bags, films, milk jugs, squeeze bottles |
| Polypropylene (PP) | Thermoplastic | 21% of nonfiber plastics | Food tubs, bottle caps, car parts, fibers |
| Polyvinyl chloride (PVC) | Thermoplastic | 12% of nonfiber plastics | Pipes, window frames, cable insulation |
| Polyethylene terephthalate (PET) | Thermoplastic | Polyester, mostly PET, is 70% of PP&A fiber output | Drink bottles, polyester clothing |
| Polystyrene (PS) | Thermoplastic | Not given here | Foam cups, protective packaging |
| Polyurethane (PUR) | Thermoset or elastomer, by formulation | Not given here | Mattress foam, insulation, coatings |
| Epoxy | Thermoset | Not given here | Adhesives, circuit boards, composite parts |
Shares come from Geyer et al. and refer to total historical production; PP&A stands for polyester, polyamide and acrylic fibers.1
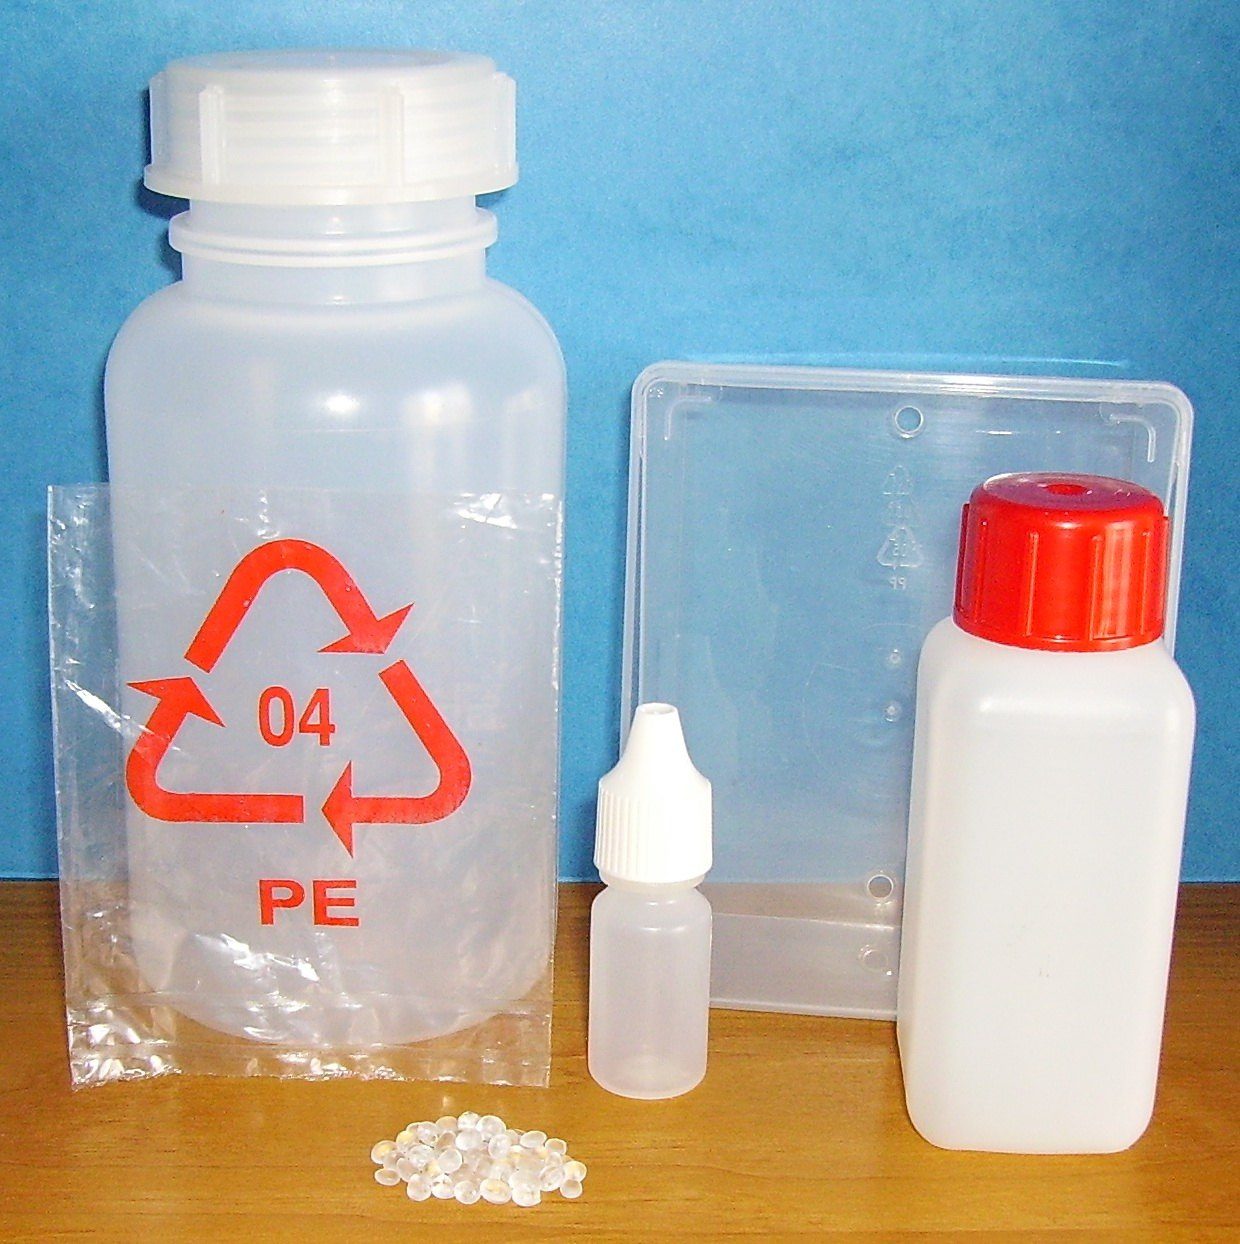
The resin codes printed on packaging cover most of these thermoplastics. The guide to types of plastic and their resin codes explains what each code is used for.
A plastic is a polymer plus additives
Pure polymer is rarely what reaches a factory floor. Geyer et al. report that the resin is mixed with additives to enhance the material's properties, and that nonfiber plastics contain on average 93% polymer resin and 7% additives by mass.1 Plasticizers, fillers and flame retardants make up about three quarters of all additives (plasticizers are the reason a rigid PVC pipe and a floppy garden hose can share a name).
How polymers are made
Ethylene and propylene, the building blocks of PE and PP, are typical feedstocks: Geyer et al. note that the vast majority of monomers used to make plastics come from fossil hydrocarbons.1 In the reactor, a catalyst or initiator opens each monomer's double bond and links the monomers into a chain. Condensation polymers such as PET join two different monomers instead and release a small molecule, such as water or methanol, at each link.
None of the commonly used plastics are biodegradable, the same study states, and bio-based or biodegradable plastics had a global production capacity of only 4 Mt.1 What "biodegradable" means on a label is a separate legal question, covered in the guide to biodegradable standards and green-claim laws.
How much polymer the world produces
Going from 2 Mt in 1950 to 380 Mt in 2015 is a 190-fold increase, using the figures in Geyer et al.1 The study puts total resins and fibers made from 1950 through 2015 at 7,800 Mt. Half of it, 3,900 Mt, came in just the last 13 years of that span.
| Indicator | Figure | Source |
|---|---|---|
| Global resin and fiber production, 1950 | 2 Mt | Geyer et al. |
| Global resin and fiber production, 2015 | 380 Mt | Geyer et al. |
| Total resins and fibers made, 1950-2015 | 7,800 Mt | Geyer et al. |
| Virgin plastics produced to date, as of the 2017 study | 8,300 Mt | Geyer et al. |
| Nonfiber plastics (resins plus additives) made since 1950 | 7,300 Mt | Geyer et al. |
| PP&A fibers made since 1950 | 1,000 Mt more | Geyer et al. |
| China's share of global resin production | 28% | Geyer et al. |
| China's share of global PP&A fiber production | 68% | Geyer et al. |
| Growth in global plastics production, 2024 | 4.1% | Plastics Europe |
| Growth in global plastics production, 2018 to 2024 | 16.3% | Plastics Europe |
| Europe's share of global plastics production | 22% in 2006, 12% in 2024 | Plastics Europe |
The longest public series is the Our World in Data indicator, which tracks annual production of polymer resin and fibers, in metric tons, from 1950 to 2019; its 2019 value comes directly from the OECD Global Plastics Outlook, released in 2022.2 For more recent years, Plastics Europe's Fast Facts 2025 gives preliminary 2024 data.3 The sources here, however, give no 2024 tonnage on the same basis as the older series, so the two cannot be stitched into a single line.
What happens to polymers after use
Packaging is the largest market for plastics: roughly 42% of all nonfiber plastics have gone into packaging, with construction next at 19%, according to Geyer et al.1 By 2015, about 6,300 Mt of plastic waste had been generated. Around 9% of it was recycled, 12% was incinerated and 79% accumulated in landfills or the natural environment.
And a large share is still in service: 2,500 Mt of plastics, or 30% of all plastics ever produced, were in use in 2015, and 407 Mt of primary plastics entered use that year alone.1 In 2014 the highest recycling rates for nonfiber plastics were in Europe (30%) and China (25%). In Europe, Plastics Europe reports that circular plastics made up 15.4% of production in 2024.3
The US case: EPA's municipal waste series
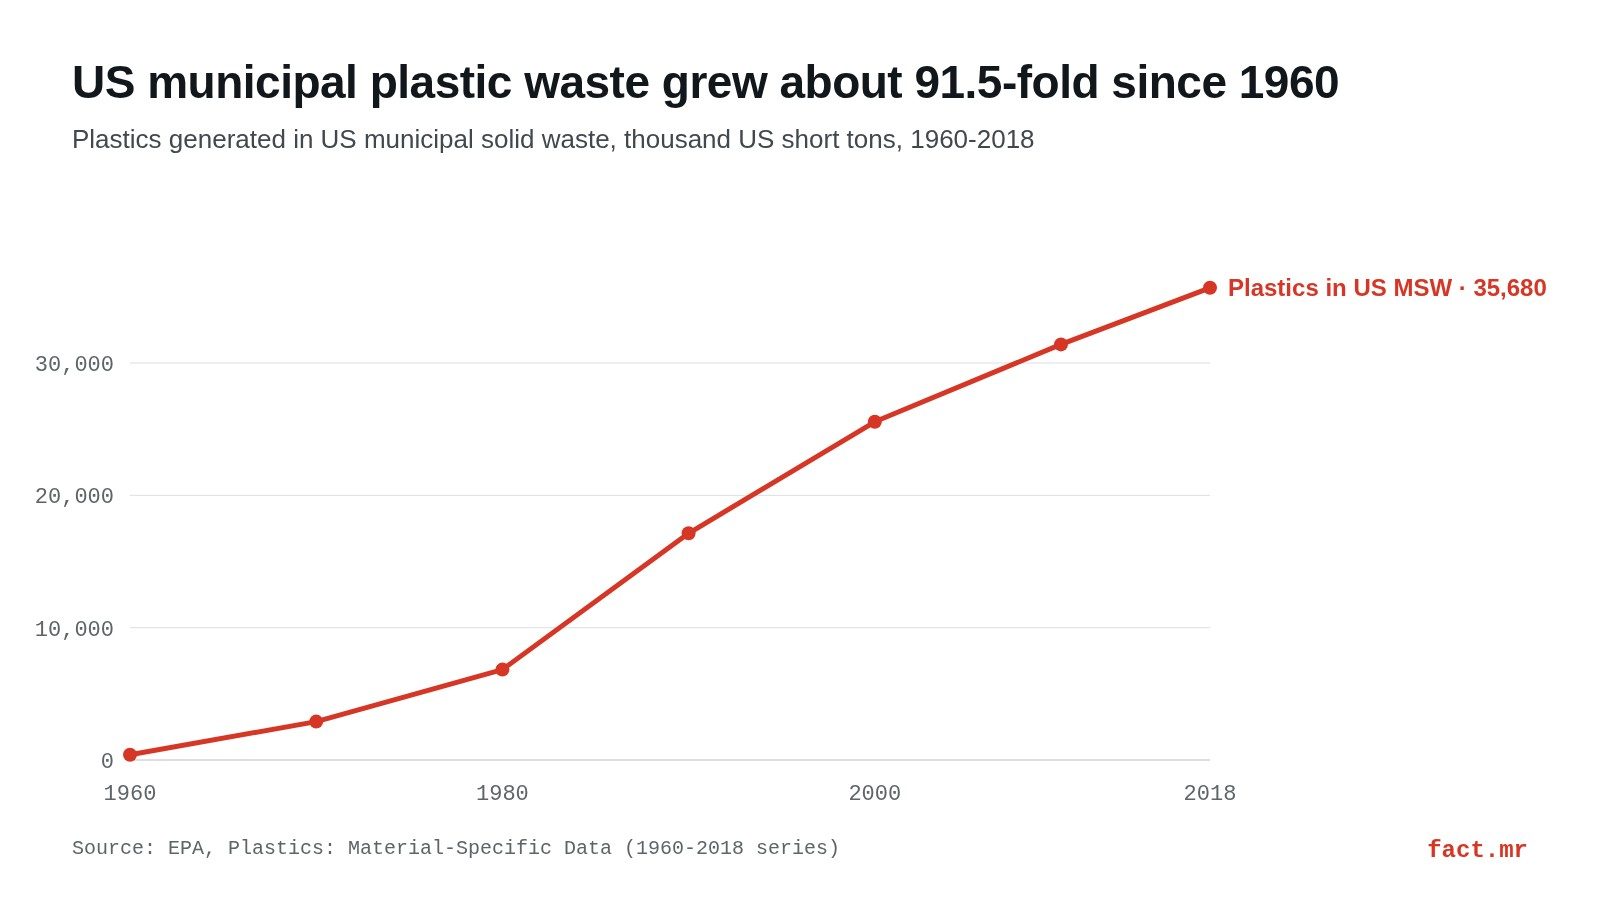
The chart at the top uses the EPA's Plastics: Material-Specific Data, which measures the generation, recycling, composting, combustion with energy recovery and landfilling of plastics in municipal solid waste (MSW).4
| Year | Plastics generated in US MSW (thousand U.S. tons) |
|---|---|
| 1960 | 390 |
| 1970 | 2,900 |
| 1980 | 6,830 |
| 1990 | 17,130 |
| 2000 | 25,550 |
| 2010 | 31,400 |
| 2018 | 35,680 |
Across the full series, generation grew about 91.5 times. In 2018 it reached 35.7 million tons, 12.2% of all US MSW, according to the EPA.4 For comparison, Geyer et al. found that plastics went from less than 1% of MSW by mass in 1960 to more than 10% by 2005 in middle- and high-income countries.1
The EPA reports 3 million tons of plastics recycled in 2018, a rate of 8.7%, with higher rates for PET bottles and jars (29.1%) and natural HDPE bottles (29.3%).4 That year 5.6 million tons were combusted, 16.3% of all MSW burned with energy recovery, and landfills received 27 million tons, 18.5% of all landfilled MSW. Measured against the series, that comes to about 75.6% of the plastics generated.
The two sources give slightly different US recycling rates. Geyer et al. put it at 9%, steady since 2012, while the EPA reports 8.7% for 2018.14 Containers and packaging was the category with the most plastic, at over 14.5 million tons in 2018.
The EPA series has one limit throughout: it counts what American homes and businesses throw out as municipal waste, so it tracks polymers at the end of their life and says nothing about how much resin US plants produce.
Frequently asked questions
What is the difference between a thermoplastic and a thermoset?
A thermoplastic is made of separate chains that soften when heated, so it can be remelted and reshaped. PE, PP and PVC, at 36%, 21% and 12% of nonfiber plastics production according to Geyer et al., are all thermoplastics. A thermoset such as epoxy cures into a crosslinked network that chars instead of melting.
Are all plastics polymers?
Yes, with a caveat. Geyer et al. define plastics as synthetic organic polymers, but a commercial plastic is a polymer plus additives. On average, nonfiber plastics contain 93% polymer resin and 7% additives by mass, and plasticizers, fillers and flame retardants make up about three quarters of those additives.
Which polymer is produced the most?
Polyethylene. It accounts for 36% of all nonfiber plastics ever produced, ahead of polypropylene at 21% and PVC at 12%, according to Geyer et al. Among fibers, polyester, most of it PET, makes up 70% of polyester, polyamide and acrylic fiber production.
Are polymers biodegradable?
Natural polymers such as cellulose break down, but none of the commonly used plastics are biodegradable, according to Geyer et al. The same study puts the global production capacity of bio-based or biodegradable plastics at only 4 Mt, compared with 380 Mt of resins and fibers produced in 2015.
Sources
- Geyer et al., Science Advances, "Production, use, and fate of all plastics ever made" (2017). Definition of plastics, polymer families and main resins, global production since 1950, shares by polymer and sector, additives, waste fate and recycling rates. pmc.ncbi.nlm.nih.gov. Accessed Oct 28, 2026.
- Our World in Data, "Global plastics production" (last updated 2023). Description and coverage of the 1950-2019 production series and origin of the 2019 value. ourworldindata.org. Accessed Oct 28, 2026.
- Plastics Europe, "Plastics the Fast Facts 2025" (2025). Growth in global plastics production in 2024 and since 2018, Europe's share of global output and share of circular plastics. plasticseurope.org. Accessed Oct 28, 2026.
- US EPA, "Plastics: Material-Specific Data" (series 1960-2018). Plastics generated, recycled, combusted and landfilled in US municipal solid waste. epa.gov. Accessed Oct 28, 2026.
Chart: our own, with data from US EPA, Plastics: Material-Specific Data (source 4).
Photo: Cjp24 (CC BY-SA 3.0, Wikimedia Commons).
fact.mr is not affiliated with consulting firms with similar names.
Found an error? Write to us at [email protected].