Comparative advantage: what it is, how it differs from absolute advantage, examples and figures
Comparative advantage explained: opportunity cost vs. productivity, the RCA index, and fuels at 79.40% of Saudi merchandise exports in 2024 (World Bank).
In this article
Comparative advantage is a country's ability to produce a good at a lower opportunity cost than its trading partners, which means it gives up less of other goods to make it. Absolute advantage is about raw productivity, and a country can lack it in every good and still gain from trade by specializing where its relative cost is lowest. World Bank data show how far specialization can go: fuels were 79.40% of Saudi Arabia's merchandise exports in 2024, against 1.50% for China.3

Key points
- Comparative advantage compares opportunity costs between goods. Absolute advantage compares output per unit of input.
- David Ricardo showed that trade pays even for a country that is more productive in every good.
- The World Bank's WITS defines the revealed comparative advantage (RCA) index: a value above unity signals an advantage in the product.
- In 2024, manufactures were 91.16% of China's merchandise exports and 23.22% of Brazil's, according to the World Bank.
- Productivity ranks countries in a different order: the United States led with $153,968.89 of GDP per person employed in 2024.
What comparative advantage means
The idea rests on opportunity cost, meaning how much of one good a country gives up to make one more unit of another. A country has comparative advantage in the good where that sacrifice is smallest relative to other countries. Productivity alone does not settle the question.
The same logic works inside a firm. A senior partner at a law firm who types faster than any assistant still hires one. Every hour spent typing is an hour of billable client work lost, so the partner's opportunity cost of typing is high even though they type faster.
Countries face the same arithmetic with their labor, land, capital and time.
Absolute vs. comparative advantage
The two terms answer different questions, and textbooks present them side by side.
| Concept | What it compares | Question it answers | Can a country lack it in every good? |
|---|---|---|---|
| Absolute advantage | Output per worker or per unit of input | Who makes more with the same resources? | Yes |
| Comparative advantage | Opportunity cost between goods | Who gives up less to make it? | No, as long as relative costs differ between countries |
Absolute advantage in the data
The World Bank's series on GDP per person employed, in constant 2021 PPP dollars, is a rough gauge of average labor productivity across a whole economy. In 2024 it stood at $153,968.89 in the United States and $123,669.32 in Germany, compared with $48,517.90 in Mexico and $45,833.83 in China.4
| Country | GDP per person employed, 2024 (constant 2021 PPP $) |
|---|---|
| United States | $153,968.89 |
| Germany | $123,669.32 |
| Japan | $86,865.59 |
| Mexico | $48,517.90 |
| China | $45,833.83 |
Taken at face value, the table suggests the United States should export almost everything. But China has the lowest figure in it, and manufactures were 91.16% of its merchandise exports in 2024, the highest share among the six economies in the export table below.2 An average for a whole economy says little about what one good costs relative to another, and that relative cost is what comparative advantage measures.
Ricardo's example: why the more productive country still trades
The standard illustration comes from the British economist David Ricardo, with England and Portugal producing cloth and wine. In his example Portugal needed fewer hours of labor than England for both goods, so it held absolute advantage in each.
Portugal's lead was larger in wine than in cloth. England was less productive in both, yet its disadvantage was smaller in cloth. If Portugal moves labor into wine and England moves labor into cloth, and the two countries trade, they end up with more of both goods combined than when each makes everything at home.
So why would the more productive country bother to trade? Because every hour Portugal spends on cloth is an hour taken from wine, where its lead is widest. Importing cloth gets Portugal that cloth for less wine than making it at home would cost.
The model assumes that labor moves freely between industries inside each country, never crosses borders and pays no transport costs (assumptions that real trade rarely honors in full).
How to measure it: the revealed comparative advantage index
Opportunity costs can't be observed directly, so trade economists infer them from what countries actually export. The online help for the World Bank's WITS trade software (2010) describes the revealed comparative advantage (RCA) index.1
RCA = (product's share in the country's exports) ÷ (product's share in world exports)
According to WITS, if the index exceeds unity, the country is said to have a revealed comparative advantage in the product. A value below unity implies a revealed comparative disadvantage.1
Worked example
Example with round, made-up numbers: a country exports $100 in total, of which $30 is coffee, while the world exports $1,000, of which $200 is coffee. Coffee is 0.3 of the country's exports and 0.2 of world exports, so the RCA is 0.3 / 0.2 = 1.5. Because the result is above one, the example country has a revealed comparative advantage in coffee.
Export concentration: the Hirschman-Herfindahl index
WITS pairs RCA with a concentration measure, the Hirschman-Herfindahl index: the sum of the squared shares of each product in total exports. A perfectly diversified export portfolio scores close to zero, and a country that exports only one product scores 1, the least diversified result.1
Example, again with invented shares of 0.5, 0.3 and 0.2 across three products: squaring them gives 0.25, 0.09 and 0.04, which add up to 0.38.
Specialization by country in World Bank data
The World Bank's export-composition indicators don't compute RCA. They do show where each country's merchandise exports are concentrated.23
| Country | Manufactures, 2024 (% of merchandise exports) | Fuel, 2024 (% of merchandise exports) |
|---|---|---|
| China | 91.16% | 1.50% |
| Germany | 84.13% | 2.07% |
| Mexico | 79.02% | 4.49% |
| United States | 55.65% | 18.31% |
| Brazil | 23.22% | 16.96% |
| Saudi Arabia | 15.90% | 79.40% |
In 2024 the fuel share in Saudi Arabia's exports was 77.90 percentage points higher than China's. Brazil is the odd case: neither category dominates, with manufactures at 23.22% and fuel at 16.96%, and the two World Bank series used here don't say what makes up the rest.
Scale matters too. According to the World Bank, China's merchandise exports were worth $3,575,795,000,000 in current dollars in 2024, compared with $2,061,691,000,000 for the United States, $1,676,408,000,000 for Germany and $617,677,000,000 for Mexico.5

What changed between 2018 and 2024
Export mixes moved only slightly over these six years. Manufactures went from 79.47% of Mexico's merchandise exports in 2018 to 79.02% in 2024, a change of −0.45 percentage points. In Saudi Arabia they went from 16.25% to 15.90%, a change of −0.35 points.2
Mexico's fuel share moved more, from 6.57% in 2018 to 4.49% in 2024, a drop of 2.07 percentage points.3 The World Bank series record the shift but don't explain it.
How the concept is used in an analysis
For a market analyst, an RCA above one flags products where a country already exports a larger share than the world as a whole does. That makes it a starting point for comparing sourcing or supplier countries. Export shares like the ones in the table above help sort economies by whether they lean on fuel or on manufactures.
A proper RCA then needs world totals from UN COMTRADE, the database WITS draws on.1
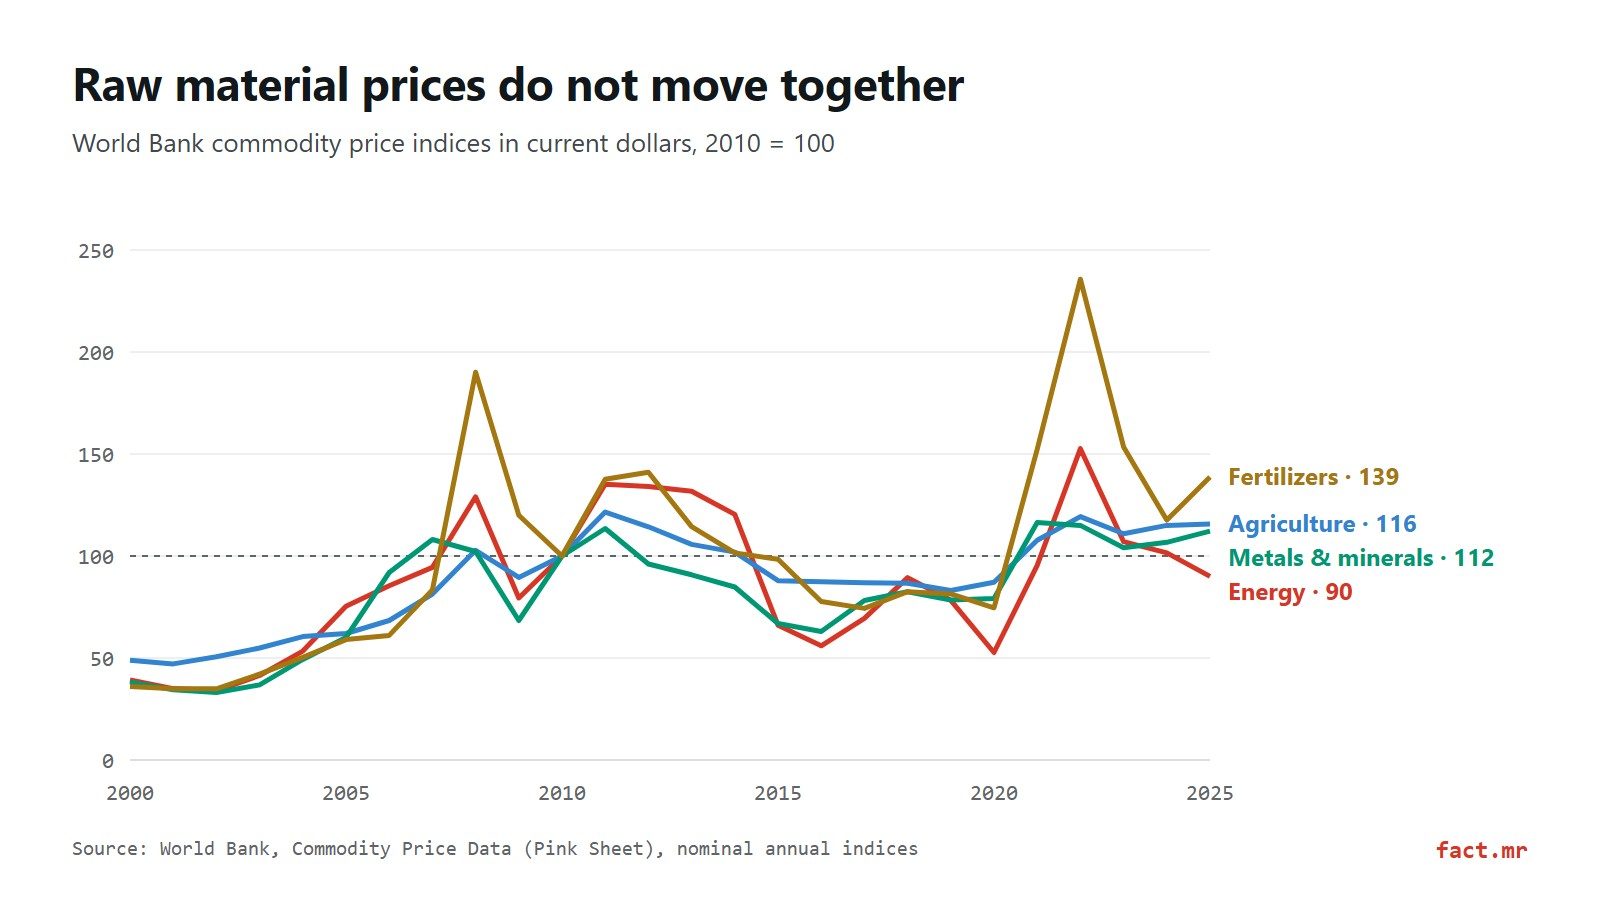
For commodity exporters the next question is usually price, and the fact.mr guides to raw materials and how their prices move and to natural gas cover that side.
When a report says a country "dominates" a product, check whether it means a share of that country's exports, an RCA or a share of world trade (they rarely match, and the same kind of trap appears in the guide on how to read industry reports).
Common confusions
Comparative advantage vs. competitive advantage
Competitive advantage is a business-strategy term for a firm that outperforms its rivals on cost, brand or technology. Comparative advantage comes from trade theory and concerns countries and their opportunity costs. Texts that use them as synonyms are describing two different things.
Export share vs. RCA
A product's share of a country's exports is only the numerator of the RCA. The denominator is the product's share of world exports, which the World Bank series cited here don't include, so these data can't produce an index for any of the six countries.
Productivity and specialization
A country with higher output per worker in every sector still gains by importing the goods where its lead is smallest, which is Ricardo's point. And the RCA reads only what was actually exported: it reveals an advantage after the fact and says nothing about the opportunity costs behind it.
Frequently asked questions
What is the difference between absolute and comparative advantage?
Absolute advantage means producing more of a good with the same resources, while comparative advantage means producing it at a lower opportunity cost. According to the World Bank, GDP per person employed in 2024 was $153,968.89 in the United States and $48,517.90 in Mexico. Even so, manufactures made up a larger share of Mexico's exports (79.02%) than of U.S. exports (55.65%).
How do you calculate the RCA index?
As WITS describes it, you divide the product's share in the country's exports by the product's share in world exports. With made-up numbers, a product worth 30 of a country's 100 in exports and 200 of the world's 1,000 gives 0.3 / 0.2 = 1.5, which indicates a revealed comparative advantage.
Can a country have no comparative advantage at all?
No. Comparative advantage is relative, so a country that is less productive in every good still has a smallest relative disadvantage somewhere, as England did in cloth in Ricardo's example. In RCA terms, values above one in some products sit alongside values below one in others, and WITS reads values below unity as a revealed comparative disadvantage.
Which country in this comparison relies most on fuel exports?
Saudi Arabia. According to the World Bank, fuels were 79.40% of its merchandise exports in 2024, compared with 18.31% for the United States, 4.49% for Mexico and 1.50% for China. That share on its own is not an RCA, because an RCA also needs the share of fuel in world exports.
Sources
- World Bank, WITS Online Help, "Trade Indicators" (2010). Definitions of the revealed comparative advantage (RCA) index, a country's share of world exports and the Hirschman-Herfindahl index, and their interpretation. wits.worldbank.org. Accessed Oct 26, 2026.
- World Bank, "Manufactures exports (% of merchandise exports)", indicator TX.VAL.MANF.ZS.UN (2018 and 2024). Manufactures share for China, Germany, Mexico, the United States, Brazil and Saudi Arabia. api.worldbank.org. Accessed Oct 26, 2026.
- World Bank, "Fuel exports (% of merchandise exports)", indicator TX.VAL.FUEL.ZS.UN (2018 and 2024). Fuel share for the same six countries. api.worldbank.org. Accessed Oct 26, 2026.
- World Bank, "GDP per person employed (constant 2021 PPP $)", indicator SL.GDP.PCAP.EM.KD (2024). Output per worker for the United States, Germany, Japan, Mexico and China. api.worldbank.org. Accessed Oct 26, 2026.
- World Bank, "Merchandise exports (current US$)", indicator TX.VAL.MRCH.CD.WT (2024). Export values for China, the United States, Germany and Mexico. api.worldbank.org. Accessed Oct 26, 2026.
Photo: James R. Tourtellotte (Public domain, Wikimedia Commons). Photo: Marek Ślusarczyk, Tupungato (CC BY 3.0, Wikimedia Commons).
fact.mr is not affiliated with consulting firms with similar names.
Found an error? Write to us at [email protected].