Market report
Anhydrite market: what it is, where US supply comes from and figures
US crude gypsum imports reached 7,770 thousand metric tons in 2023, according to the USGS Minerals Yearbook. Official supply data on anhydrite and gypsum.
The anhydrite market is the trade in anhydrite, a mineral that US statistics count together with gypsum. USGS reports import and export data for "Gypsum; anhydrite" under one tariff code, and the USGS Minerals Yearbook 2023 puts US crude gypsum imports at 7,770 thousand metric tons in 2023. None of the USGS tables used here gives anhydrite its own line.
Key points
- In USGS trade data, anhydrite shares Harmonized Tariff Schedule code 2520.10.0000, "Gypsum; anhydrite," with crude gypsum.3
- US crude gypsum production was 21,500 thousand metric tons in 2023, compared with 21,600 thousand in 2019. That is a drop of 0.5%.2
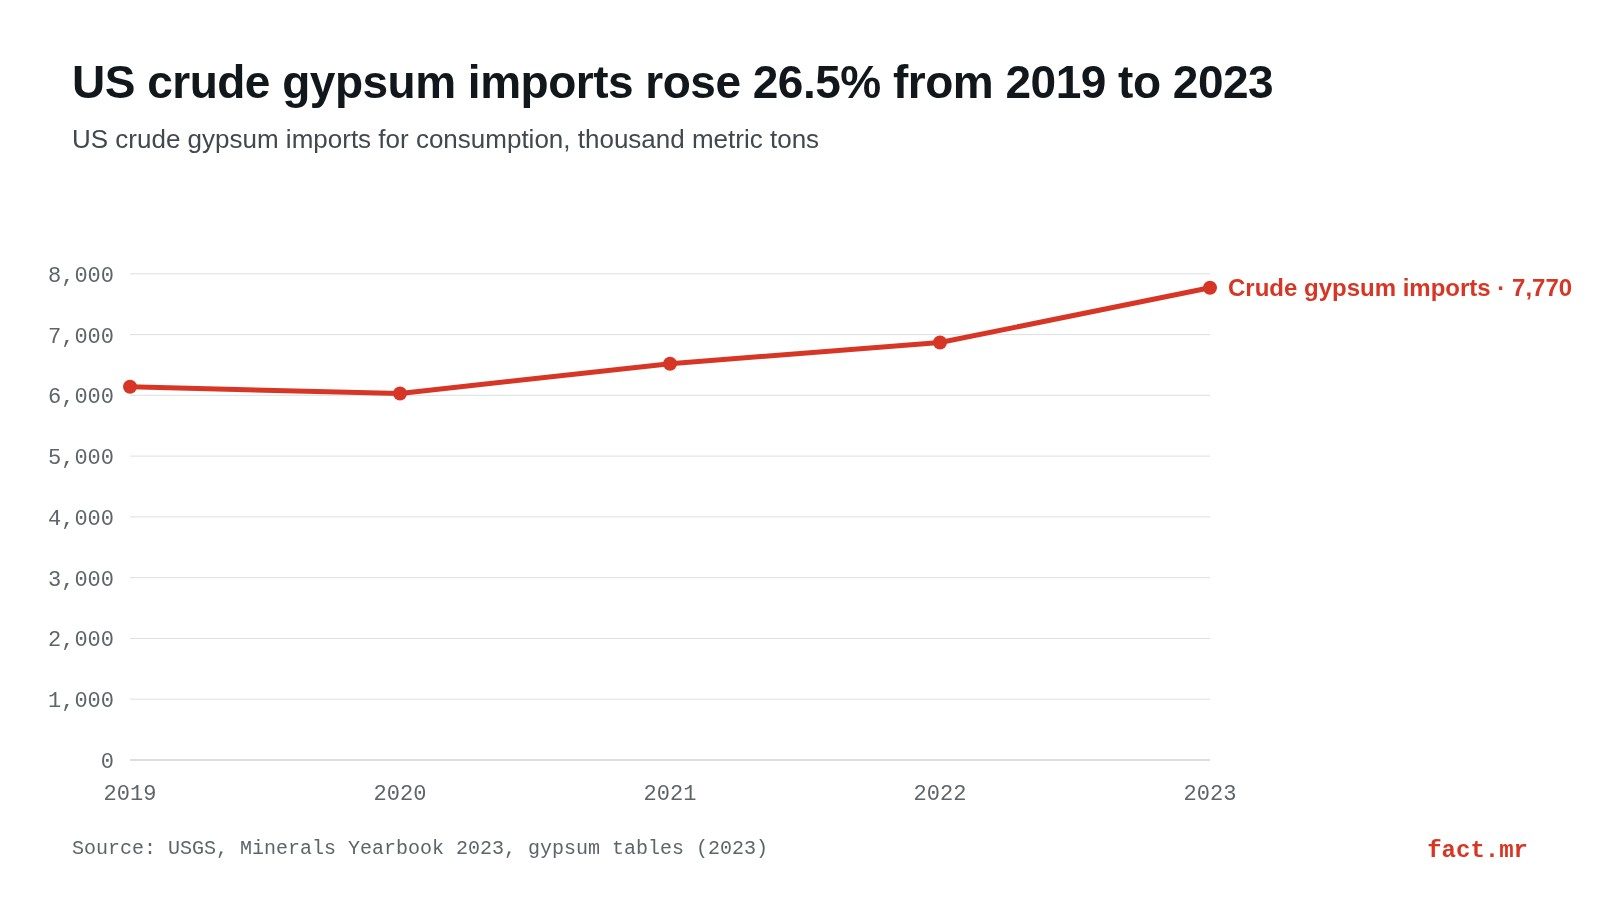
- Imports of crude gypsum rose from 6,140 to 7,770 thousand metric tons between 2019 and 2023, an increase of 26.5%. In 2023 they equaled 17.4% of apparent consumption.2
- Spain supplied 3,160 thousand metric tons in 2023 (40.7% of the total), Mexico 2,200 thousand and Canada 2,060 thousand. The Canadian figures include anhydrite.2
- Preliminary quarterly data show 19,500,000 metric tons of crude gypsum mined and 6,650,000 metric tons imported in 2025.3
What anhydrite is and where it shows up in official data
In US statistics, anhydrite is a footnote. The USGS Mineral Industry Surveys for gypsum say that import and export figures cover "Gypsum; anhydrite," HTS code 2520.10.0000, so the two minerals cross the US border under the same heading.3
Plaster, which is calcined gypsum, has a separate code: 2520.20.0000. Someone looking at customs data therefore sees crude gypsum and anhydrite on one line and the processed product on another. Nothing in either code separates anhydrite from gypsum.
The Minerals Yearbook 2023 import table adds one more clue. Its rows come from the U.S. Census Bureau, and the line for Canada has a footnote: "Includes anhydrite."2 In 2023 Canada sent 2,060 thousand metric tons of crude gypsum to the United States, valued at 47,600 thousand dollars.
So how much of that tonnage was anhydrite? The table does not say. And no USGS gypsum page or table consulted gives a separate tonnage, price or end use for anhydrite, whether mined in the United States or imported.
Any honest figure for the anhydrite market has to start with that gap.
How USGS measures gypsum and anhydrite supply
The National Minerals Information Center (NMIC) of the U.S. Geological Survey publishes "statistics and information on the worldwide supply of, demand for, and material flow of gypsum."1 Its figures come from a canvass of more than 18,000 mineral producers and consumers, which fill out about 40,000 survey forms. Companies take part voluntarily.4
The series is long. USGS gathered US mineral statistics from 1882 to 1924, the U.S. Bureau of Mines took over in 1925-95, and the work went back to USGS in 1996. Units are standardized to metric tons and dollars per metric ton.
Gypsum statistics appear in several USGS publications, and each one serves a different purpose:
| Publication | What it covers | Edition used here |
|---|---|---|
| Minerals Yearbook, gypsum tables | Annual data (advance release): production, trade, mines by state, imports by country | 2023 tables, posted December 13, 2024 |
| Mineral Industry Surveys, Gypsum | Preliminary quarterly data, for information only | Second quarter of 2026, with data available through September 1, 2026 |
| Mineral Commodity Summaries | Industry structure, government programs, tariffs and 5-year salient statistics for over 90 minerals and materials | Mineral Commodity Summaries 2026 |
| Historical Statistics (Data Series 140) | Production, trade, stocks, consumption and unit value of nearly 90 mineral commodities since 1900 | Gypsum file updated in 2022 (XLSX) |
USGS describes the Mineral Commodity Summaries as the earliest government publication with estimates for the nonfuel mineral industry.5 The yearbook comes out later. The gypsum tables for 2023 were posted on December 13, 2024.
Apparent consumption, the figure most often misread
USGS defines apparent consumption in general terms as production plus imports minus exports, plus or minus the change in stocks.4 The gypsum table in the yearbook uses its own version: crude production plus synthetic gypsum used plus imports minus exports.2 That definition includes synthetic material, so apparent consumption is well above mined output.
US crude gypsum production and imports, 2019-2023
From 2019 to 2023, domestic output stayed in a narrow range while imports grew. Production figures exclude byproduct gypsum. Imports are listed as imports for consumption.
| Year | Crude gypsum production (thousand metric tons) | Crude gypsum imports (thousand metric tons) | World production (thousand metric tons) |
|---|---|---|---|
| 2019 | 21,600 | 6,140 | 149,000 |
| 2020 | 21,300 | 6,030 | 152,000 (revised) |
| 2021 | 20,800 | 6,520 | 159,000 (revised) |
| 2022 | 22,300 | 6,870 | 156,000 (revised) |
| 2023 | 21,500 | 7,770 | 158,000 |
Source: USGS, Minerals Yearbook 2023, gypsum tables.2 World figures for 2019 and 2023 may include estimates.
Production ended the period 0.5% below where it started. Imports fell in 2020 and then rose in every year after that, ending 26.5% above the 2019 level. The yearbook does not explain why. It reports the volumes and does not discuss causes.
Several other 2023 figures fill out the balance sheet. Exports were small: 44 thousand metric tons. USGS estimated synthetic gypsum used at 15,400 thousand metric tons, and apparent consumption reached 44,600 thousand. Imports therefore covered 17.4% of apparent consumption.
The value of US crude gypsum production was 258,000 thousand dollars in 2023. That works out to an average of 12.0 dollars per metric ton of crude gypsum produced.
Where US crude gypsum is mined
USGS counted 45 active crude gypsum mines in 2023, compared with 43 in 2022. The yearbook groups states into regions, and two groups stand out:
| Region | Active mines, 2023 | Output (thousand metric tons) | Value (thousand dollars) |
|---|---|---|---|
| Arkansas, Kansas, Oklahoma, Texas | 17 | 7,790 | 93,500 |
| Nevada and Utah | 9 | 4,860 | 58,300 |
| United States, total | 45 | 21,500 | 258,000 |
Every state number in that table is an estimate (USGS states this plainly in a footnote, which a reader in a hurry can easily miss). The reason is that all major gypsum producers report national totals instead of figures for each state.2 The yearbook does not say how many of these mines extract anhydrite along with gypsum.
Who supplies US crude gypsum and anhydrite imports
A buyer comparing suppliers will find more detail on trade than on mines. The 2023 yearbook lists imports by country of origin, using Census data:
| Country | Quantity, 2023 (thousand metric tons) | Value, 2023 (thousand dollars) | Note |
|---|---|---|---|
| Spain | 3,160 | 63,500 | 40.7% of the total |
| Mexico | 2,200 | 36,100 | |
| Canada | 2,060 | 47,600 | Includes anhydrite |
| Turkey | 293 | 4,680 | |
| Total | 7,770 | 155,000 |
The quarterly survey gives a more recent view. For the full year 2025, it reports crude gypsum imports under HTS 2520.10.0000 of 6,650,000 metric tons: 2,840,000 from Spain, 2,030,000 from Canada and 1,620,000 from Mexico.3 Those figures are preliminary. They also use metric tons, while the yearbook uses thousands, so the two tables should be read separately.
Spain was the largest supplier in both editions. But the ranking of Mexico and Canada changed between 2023 and 2025, and neither publication offers a reason.
Latest quarterly data: 2025 and 2026
The Mineral Industry Surveys for the second quarter of 2026 is the most recent USGS gypsum report. It includes data available through September 1, 2026.
| Indicator | Full year 2025 | 2026 |
|---|---|---|
| Crude gypsum mined (metric tons, includes estimates) | 19,500,000 | 5,050,000 in the second quarter |
| Crude gypsum imports, HTS 2520.10.0000 (metric tons) | 6,650,000 | 3,040,000 in the first half |
| Synthetic gypsum in crude supply (metric tons, estimated) | 16,500,000 | |
| Crude gypsum consumption, excluding synthetic (metric tons) | 26,100,000 | |
| Calcined gypsum produced (metric tons) | 17,200,000 | |
| Gypsum board products (thousand square feet) | 25,400,000 total supply | 6,770,000 in sales, second quarter |
The board figures come from the Gypsum Association, which USGS cites as the source. USGS also gives the conversion: one square meter equals 10.78 square feet.3
Be careful with the 2025 consumption line. The 26,100,000 metric tons excludes synthetic gypsum, so it does not measure the same thing as the 2023 apparent consumption of 44,600 thousand metric tons, which includes synthetic material.
What USGS says gypsum is used for
According to USGS, most gypsum in the United States is used to make wallboard for homes, offices and commercial buildings. A typical new American home contains more than 7 metric tons of gypsum.1
| Use | What USGS reports | Related figure |
|---|---|---|
| Wallboard | Where most US gypsum goes | 25,400,000 thousand square feet of board supply in 2025 |
| Housing | More than 7 metric tons in a typical new home | |
| Concrete | For highways, bridges and buildings | No tonnage in the tables used here |
| Soil conditioning | On large tracts of suburban and agricultural land | No tonnage in the tables used here |
| Calcined gypsum | The processed product, also called plaster | 18,300 thousand metric tons produced in 2023 |
The value of manufactured gypsum products sold in the United States reached 5,640,000 thousand dollars in 2023, according to the yearbook.2 That figure is for gypsum products in general.
Readers looking for anhydrite's own end uses will notice what is missing. The USGS gypsum page and tables do not give anhydrite's share of any of these uses. For comparison, other industrial minerals on this site have similar notes: sulfur supply and the US salt industry.
Terms that get confused
Anhydrite searches often mix up several USGS categories. The labels below match the ones the agency uses:
- Crude gypsum: mined rock. US production was 21,500 thousand metric tons in 2023, excluding byproduct gypsum.
- Synthetic gypsum: a separate supply line. It is counted in apparent consumption, with an estimated 15,400 thousand metric tons used in 2023.
- Calcined gypsum or plaster: the processed product, traded under HTS 2520.20.0000.
- Anhydrite: traded under HTS 2520.10.0000 together with gypsum. It appears by name in the Canadian import footnote.
- Apparent consumption vs. consumption: the yearbook version includes synthetic gypsum, while the 2025 quarterly consumption figure does not.
Any figure for the total value or growth of anhydrite cannot be checked against a USGS series. A guide to testing such numbers against a public source is in how to read industry reports.
The most recent annual data in these sources are the Minerals Yearbook 2023 gypsum tables, posted on December 13, 2024. Everything for 2025 and 2026 comes from the quarterly survey, which USGS labels preliminary and for information only.
Frequently asked questions
Is anhydrite counted separately from gypsum in US statistics?
No. USGS reports trade under HTS code 2520.10.0000, "Gypsum; anhydrite," which puts both minerals on one line. The Minerals Yearbook 2023 notes that Canada's import figures, 2,060 thousand metric tons in 2023, include anhydrite, but it does not say how much of that was anhydrite.
Where does the United States import crude gypsum and anhydrite from?
In 2023, according to the USGS Minerals Yearbook, Spain shipped 3,160 thousand metric tons, Mexico 2,200 thousand, Canada 2,060 thousand and Turkey 293 thousand, for a total of 7,770 thousand. Preliminary figures for 2025 show Spain at 2,840,000 metric tons and Canada at 2,030,000.
How much crude gypsum does the United States mine?
USGS reports 21,500 thousand metric tons in 2023 from 45 active mines, valued at 258,000 thousand dollars. The quarterly survey estimates 19,500,000 metric tons mined in 2025 and 5,050,000 in the second quarter of 2026. Figures for individual states are estimates.
Is there an official overall figure for the anhydrite trade?
Not in the USGS sources used here. The closest official figures are for the shared trade category: in 2023 the United States imported 7,770 thousand metric tons of crude gypsum, worth 155,000 thousand dollars, according to Census data published in the USGS Minerals Yearbook.
Sources
- U.S. Geological Survey, National Minerals Information Center, "Gypsum Statistics and Information." Scope of the statistics, main uses of gypsum, gypsum in a typical new home. usgs.gov. Accessed Nov 19, 2026.
- U.S. Geological Survey, Minerals Yearbook 2023, gypsum tables (myb1-2023-gypsu-ERT.xlsx, posted December 13, 2024). Production, imports by country (Census data), exports, synthetic gypsum, apparent consumption, mines by state, world production. d9-wret.s3.us-west-2.amazonaws.com. Accessed Nov 19, 2026.
- U.S. Geological Survey, Mineral Industry Surveys, Gypsum, second quarter of 2026 (mis-2026q2-gypsu.xlsx). HTS codes, preliminary 2025 and 2026 data on mining, imports, synthetic gypsum, calcined gypsum and board products. d9-wret.s3.us-west-2.amazonaws.com. Accessed Nov 19, 2026.
- U.S. Geological Survey, "Historical Statistics on Mineral Commodities in the United States" (Data Series 140). Survey coverage, history of data collection, definition of apparent consumption, units. usgs.gov. Accessed Nov 19, 2026.
- U.S. Geological Survey, "Mineral Commodity Summaries" (2026 edition). Scope and contents of the annual report. usgs.gov. Accessed Nov 19, 2026.
Chart: our own, with data from USGS, Minerals Yearbook 2023, gypsum tables (2023) (source 2).
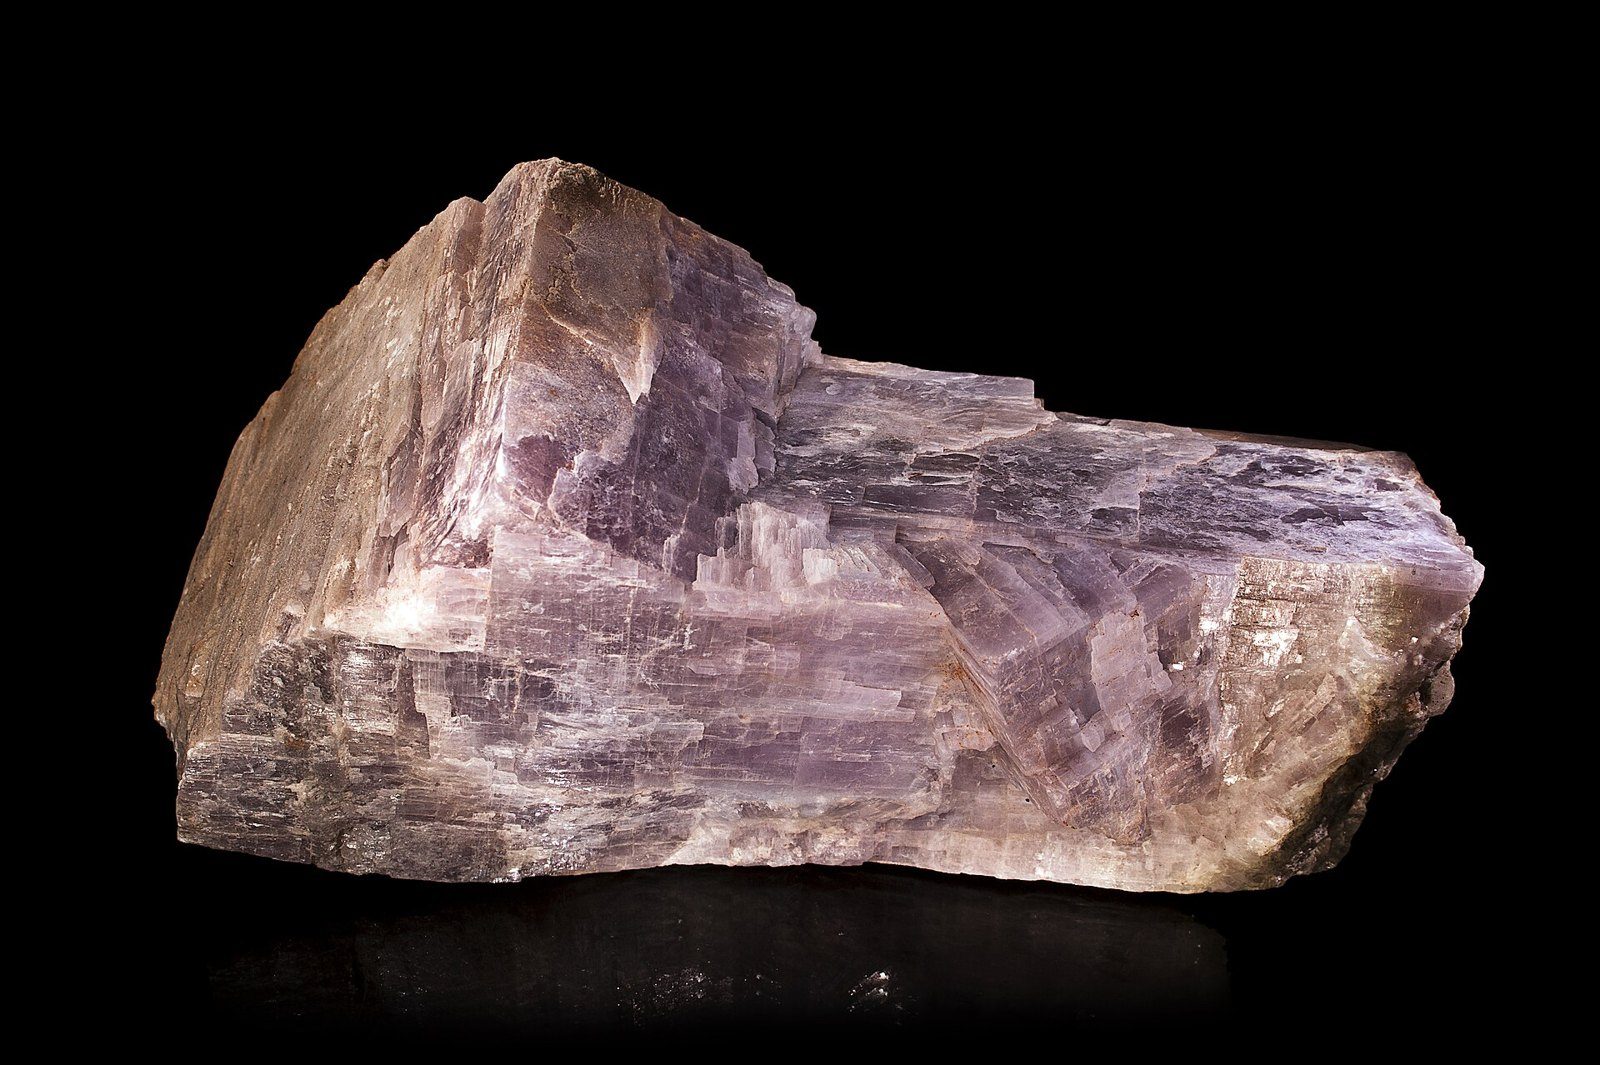
Photo: Didier Descouens (CC BY-SA 3.0, Wikimedia Commons).
fact.mr is not affiliated with consulting firms with similar names.
Found an error? Write to us at [email protected].
Related reports
Iodine market: what it is, who produces it, what it costs and official data
Chile produced an estimated 21,000 metric tons of crude iodine in 2023, per USGS. Who else produces iodine, what it costs and what the WHO …
White Spirit Market Size, Share & Forecast 2026-2032
12.54 USD bn
Estimated market size in 2032
- 2026
- 8.96 USD bn
- Forecast period
- 2026–2032
Sales Engagement Software Market Size, Share & Forecast 2026-2032
33.5 USD bn
Estimated market size in 2032
- 2026
- 13.8 USD bn
- Forecast period
- 2026–2032