Org chart: types, how to read one and real examples from DOL, OPM and Mexico's SAT
What an org chart is, the main types (hierarchical, functional, matrix, flat), how to read one and real charts from the U.S. Department of Labor, OPM and Mexico's SAT.
In this article
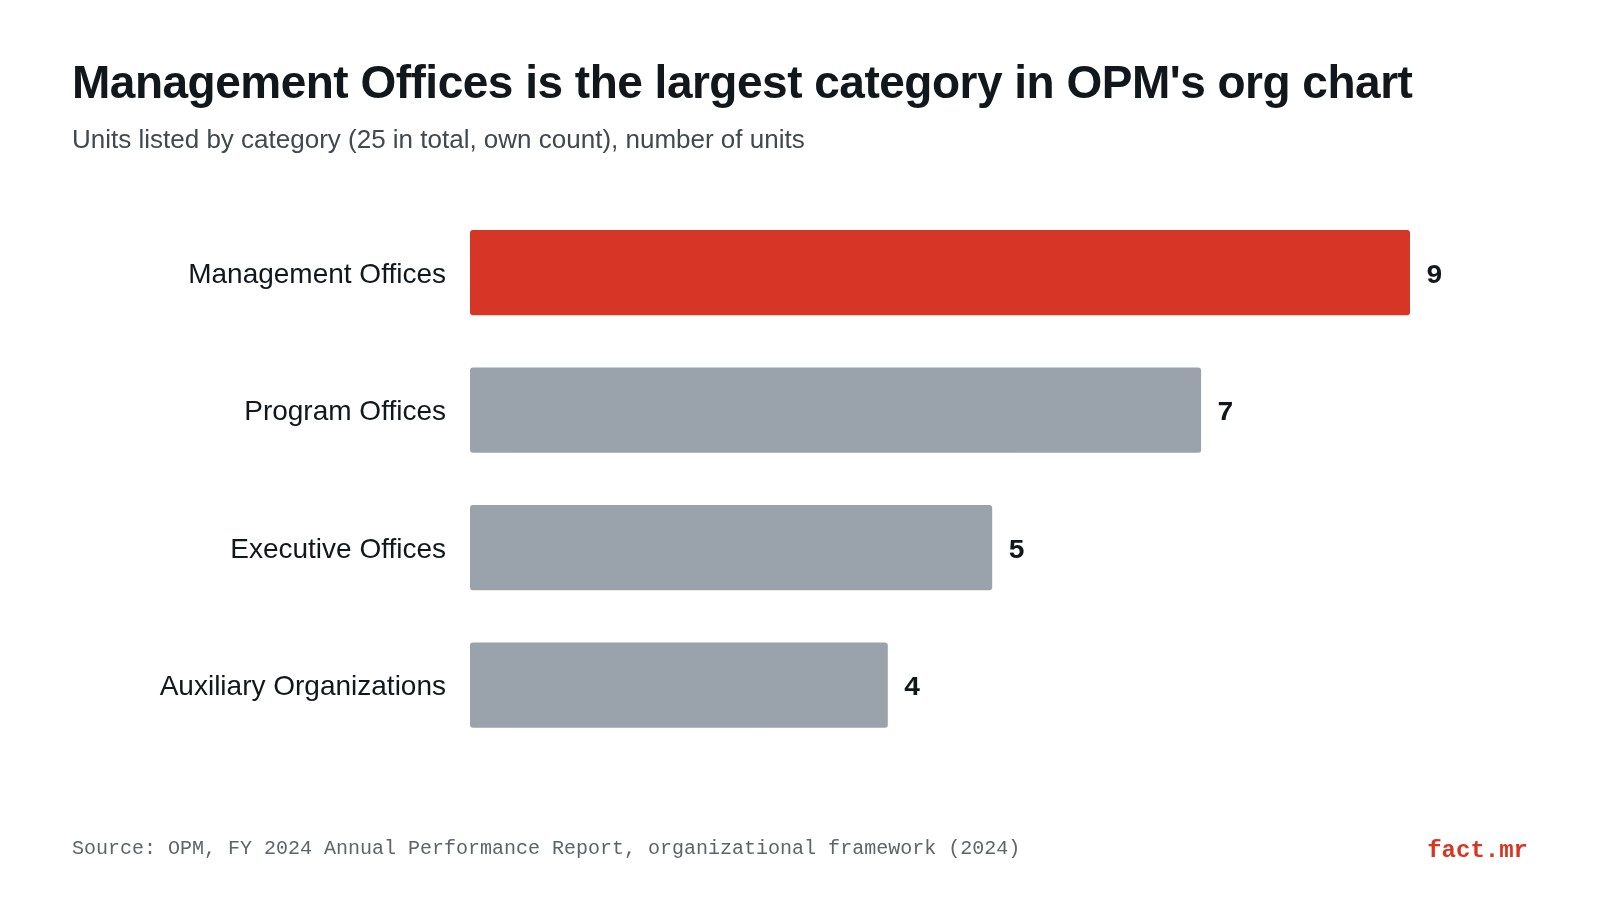
An org chart (short for organizational chart) is a diagram of the units an organization is divided into, who reports to whom and which office handles each function. It uses boxes and lines, and its shape depends on how the units are grouped. The chart of the U.S. Office of Personnel Management (OPM), described in its FY 2024 Annual Performance Report, lists 25 units in four categories2.
Key points
- An org chart shows units, reporting lines and functions. The U.S. Department of Labor publishes its own on a page titled «Organizational Chart».
- By layout, a chart is vertical (hierarchical), horizontal or circular. By grouping, it is functional, divisional (by product) or matrix. Flat structures, with few layers, are a separate case.
- OPM's chart groups 25 units: 9 management offices, 7 program offices, 5 executive offices and 4 auxiliary organizations.
- In Mexico, the tax agency's General Organization Manual, published in the official gazette on February 1, 2024, carries its org chart as Section V.
- The BLS projects U.S. employment of top executives to grow 5% from 2025 to 2035. In the EU-27, managers made up 5.29% of employment in 2024, a share calculated from Eurostat figures.
What an org chart is for
People inside an organization and people outside it use the chart for different things. Mexico's tax agency, the Servicio de Administración Tributaria (SAT), states both uses in its General Organization Manual: staff check it to understand the context of their own duties, and the public uses it to find which administrative unit handles their matter3. The SAT sits roughly where the IRS sits in the U.S.: it is a deconcentrated administrative body (órgano administrativo desconcentrado) of Mexico's Ministry of Finance and Public Credit.
The same manual gives a handy working definition by splitting two things that often get blurred. Section V is the Organigrama (the org chart) and Section VI is the Estructura Orgánica, the organizational structure, which describes the general functions of the general, central and deconcentrated administrations and of the sub-administrations.
The chart is the drawing; the structure is the text that says what each box does.
A small business never files its chart with a government gazette. But it uses one for the same reasons: so each person knows who they report to, and so a client or supplier knows whom to call.
How to read an org chart
Start at the top box, or the center if the chart is circular. That is the head of the organization. Each solid line down from a box marks a direct reporting relationship, and boxes on the same row are peers at the same level.
Boxes hanging off to the side of a line are usually staff or advisory units, which support the head without running a line of business. A dotted line, by common convention, marks a secondary or advisory relationship. Check the legend before assuming either (many charts have none).
Types of org chart
Two axes, which combine freely, describe any chart: how it is drawn and what logic groups the units. A single chart can be vertical and functional at once.
By layout: hierarchical, horizontal and circular
- Hierarchical (vertical): the top position sits at the top and each level steps down. This is the classic format in government organization manuals.
- Horizontal: the same hierarchy, running left to right. It fits a landscape page or a slide better when there are many levels.
- Circular: leadership sits in the middle and each ring is a level. The «top and bottom» feel fades, though the chain of command stays exactly the same.
By grouping: functional, divisional and matrix
A functional chart groups people by specialty: finance, operations, HR, IT. A divisional chart, also called a product chart, builds a complete unit for each business line or service, with its own sales or support team. A matrix chart crosses both, so one person can report to a department head and a project lead at the same time, which is common in teams that work with agile methodology and Scrum.
A flat org chart has few layers between leadership and everyone else. Which management style suits each structure is a separate question, covered in leadership styles.
| Type | What it looks like | Where it usually shows up |
|---|---|---|
| Hierarchical (vertical) | Top-down chain of command | Government agencies, organization manuals |
| Horizontal | Hierarchy running left to right | Slide decks, structures with many levels |
| Circular | Leadership at the center, levels in rings | Organizations that want to downplay hierarchy visually |
| Functional | Departments by specialty | Small businesses and offices with stable functions |
| Divisional (by product) | One unit per business line or service | Companies with several business lines |
| Matrix | Dual reporting: department and project | Consulting, engineering, software development |
| Flat | Few management layers | Small teams and young companies |
Real org chart examples
U.S. Department of Labor: the org chart as a web page
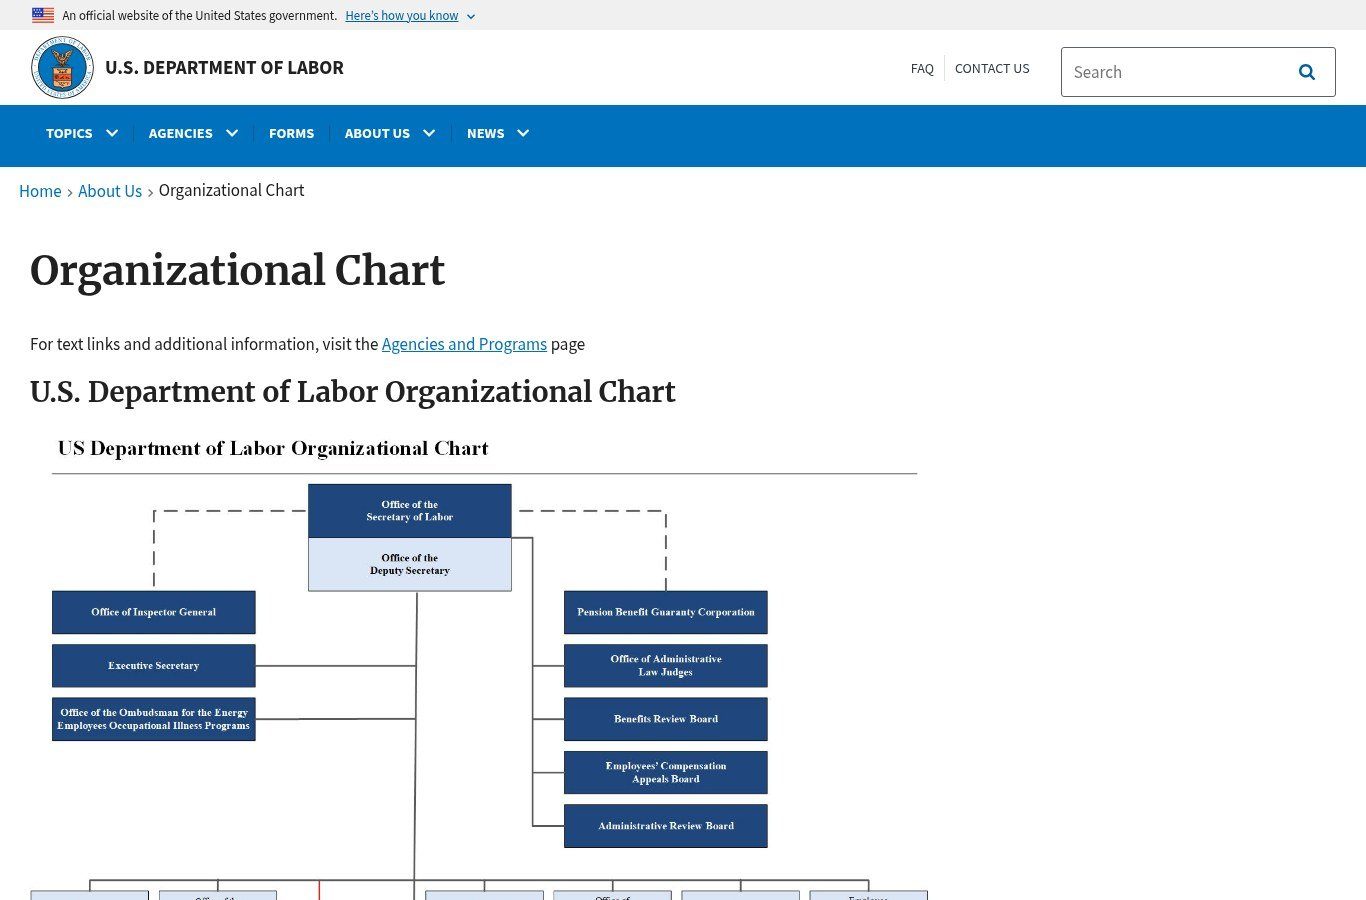
The Department of Labor (DOL) publishes a page titled «Organizational Chart» with the department's chart1. To read the names as text, the page itself points readers to a separate Agencies and Programs page. That is a useful hint for anyone building one: a chart saved as an image can't be searched or copied, so pair it with a plain list.
OPM: four categories, 25 units
OPM sets personnel policy for the U.S. federal government. Its FY 2024 Annual Performance Report, which tracks progress on its FY 2022-FY 2026 Strategic Plan, describes an organizational framework made of offices that directly and indirectly support the agency's mission2.
| OPM org chart category | Units listed |
|---|---|
| Management Offices | 9 |
| Program Offices | 7 |
| Executive Offices | 5 |
| Auxiliary Organizations | 4 |
| Total | 25 |
The details show what each box is for. The Office of the Director exists to lead and serve the federal government with policies and services for a trusted, effective civilian workforce. Workforce Policy and Innovation (WPI) is the government-wide workforce policy office, and the Suitability Executive Agent (SuitEA) became a distinct program office in December 2016.
Boxes of the same size can hide very different loads. Retirement Services covers approximately 2.8 million active employees, including the U.S. Postal Service, and more than 2.7 million annuitants, survivors and family members.
The Chief Human Capital Officers Council is chaired by the OPM Director and brings together, among others, 26 CHCOs and 26 Deputy CHCOs. And a unit founded in 1964, the President's Commission on White House Fellows, still appears on the list.
Mexico's SAT: a chart redrawn with every regulation
The SAT began operating on July 1, 1997. Its basic structure after the 1997 changes included the Presidency, the Social Communication Unit, the Technical Secretariat of the Career Tax Service Commission, general directorates for oversight, tax planning, international tax affairs, coordination with the states and information technology, plus the general administrations and a General Resources Coordination3.
| Date published in the DOF | What was published |
|---|---|
| June 30, 1997 | First Internal Regulations of the SAT |
| December 3, 1999 | New Internal Regulations, with changes to the structure |
| March 22, 2001 | New Internal Regulations |
| August 24, 2015 | New Internal Regulations that restructured the administrative units |
| February 1, 2024 | SAT General Organization Manual, with its org chart |
The DOF is the Diario Oficial de la Federación, Mexico's official gazette, comparable to the Federal Register. The lesson of that timeline applies to any company: the chart has to change every time the structure does, and it goes stale if nobody owns it.
How many managers per org chart? A way to calculate it
Is there a «normal» number of bosses? No rule sets one. Labor statistics give a benchmark instead: the share of managers among all employed people.
The formula is managers ÷ total employment × 100. Eurostat publishes both figures in its lfsa_egai2d dataset, which classifies employed people aged 15 to 74 by occupation under ISCO-08 at the two-digit level; managers are group 14.
Example: in the EU-27 in 2024 there were 10,923.1 thousand managers out of 206,449.6 thousand employed people, so 10,923.1 ÷ 206,449.6 × 100 = 5.29%.
| Area (2024) | Total employment (thousands) | Managers (thousands) | Managers / employment | Eurostat flag |
|---|---|---|---|---|
| EU-27 | 206,449.6 | 10,923.1 | 5.29% | |
| Germany | 42,365.9 | 1,849.1 | 4.36% | |
| France | 28,969.7 | 2,112.2 | 7.29% | «bd»: break in series, definition differs |
| Spain | 21,634.0 | 859.7 | 3.97% | «d»: definition differs |
The flags matter. France and Spain use definitions that differ from the standard one, so the gap between France's 7.29% and Spain's 3.97% can't be read as a pure difference in how many bosses their companies have, and Eurostat's table doesn't say where the gap comes from. For reading figures like these without overreaching, see how to read industry reports.
For the U.S., the Bureau of Labor Statistics projects in its Occupational Outlook Handbook that employment of top executives will grow 5% from 2025 to 2035, faster than the average for all occupations, with about 304,100 openings a year on average over the decade5.
| Occupation (BLS) | Projected employment change, 2025-2035 |
|---|---|
| Management occupations | 6% |
| General and operations managers | 5% |
| Top executives | 5% |
| Chief executives | 3% |
| Total, all occupations | 3% |
The BLS notes that these values are rounded to the nearest 100 or whole percent. It expects demand for general and operations managers to grow as organizations increasingly rely on them to keep operations running smoothly.
What Mexican rules say about a public org chart
For the SAT, the org chart is part of a document published in the official gazette. The SAT manual provides for an Internal Control Body, whose head is appointed under Article 37, section XII, of the Organic Law of the Federal Public Administration, and its first transitory article put it into force the day after publication in the DOF. To check any Mexican agency's current structure, consult the text in force in the DOF; for a private company, the chart is an internal document.
Common mix-ups
- Org chart vs. organizational structure. In the SAT manual they are separate sections: Section V is the drawing, Section VI the functions of each unit.
- Org chart vs. organization manual. The manual contains the chart, along with the agency's history and each unit's functions.
- «Manager» in statistics vs. on your payroll. ISCO-08 group 1, used by Eurostat, doesn't match every job that carries a manager title in a small company. The BLS separates chief executives, who govern and make high-level decisions, from general and operations managers.
The Eurostat figures above cover the EU-27, Germany, France and Spain only, and the BLS figures above are growth projections rather than shares, so a U.S. or Mexican company has no matching manager-share benchmark in this data.
Frequently asked questions
What is an org chart used for?
It shows an organization's units and who reports to whom. Mexico's SAT General Organization Manual, published on February 1, 2024, says it helps staff understand the context of their duties and helps the public find the right unit.
What are the main types of org chart?
By layout: hierarchical (vertical), horizontal and circular. By grouping: functional, divisional (by product) and matrix, plus flat charts with few layers. OPM's chart, with 25 units in four categories, is grouped by type of office.
Where can I find a real org chart to use as a template?
Government websites are a good start. The U.S. Department of Labor publishes its «Organizational Chart» on dol.gov, OPM describes its own in the FY 2024 Annual Performance Report, and Mexico's DOF carries the SAT manual with its org chart section.
How many managers should an org chart have?
No rule sets a number. As a statistical reference, shares calculated from Eurostat data for 2024 put managers at 5.29% of employment in the EU-27, 4.36% in Germany, 3.97% in Spain and 7.29% in France, with differing definitions for Spain and France.
Sources
- U.S. Department of Labor (DOL), «Organizational Chart» (n.d.). The department's org chart and the pointer to its Agencies and Programs page. dol.gov. Accessed Oct 27, 2026.
- U.S. Office of Personnel Management (OPM), «2024 Annual Performance Report - Organizational Framework» (FY 2024). Categories and units of the org chart, missions of the Office of the Director and WPI, makeup of the CHCO Council, reach of Retirement Services, SuitEA and the President's Commission on White House Fellows. opm.gov. Accessed Oct 27, 2026.
- Diario Oficial de la Federación (Mexico), «Manual de Organización General del Servicio de Administración Tributaria» (DOF, February 1, 2024). Purpose of the manual, org chart and structure sections, history and internal regulations of the SAT, Internal Control Body and entry into force. dof.gob.mx. Accessed Oct 27, 2026.
- Eurostat, «Employed persons by detailed occupation (ISCO-08 two digit level)», lfsa_egai2d (2024). Employed persons and managers in the EU-27, Germany, Spain and France, with flags. ec.europa.eu. Accessed Oct 27, 2026.
- U.S. Bureau of Labor Statistics (BLS), «Top Executives», Occupational Outlook Handbook (2025-2035 projections). Projected employment growth, annual openings and duties of top executives. bls.gov. Accessed Oct 27, 2026.
Chart: our own, with data from OPM, FY 2024 Annual Performance Report, organizational framework (source 2).
Photo: our own screenshot of dol.gov, Oct 27, 2026.
fact.mr is not affiliated with consulting firms with similar names.
Found an error? Write to us at [email protected].