Leadership styles: the main types, examples and what Gallup data says about managers
Leadership styles explained with examples, from autocratic to servant and coaching, and what Gallup data shows about how much managers shape engagement.
In this article
The leadership styles cited most often are autocratic, democratic, laissez-faire, transformational, transactional, servant and coaching. Each one describes how a manager makes decisions and how much they hand off, and none of them works for every team. The part that has been measured is how much the manager matters: a 2015 Gallup article based on US data found that managers account for at least 70% of the variance in employee engagement scores4.
Key points
- Leadership styles differ in who makes the call and how much room the team has to carry it out.
- Gallup's State of the Global Workplace 2026 found that 20% of employees worldwide were engaged in 2025, the lowest level since 2020.
- Managers' own engagement fell from 27% to 22% between 2024 and 2025, according to the same report.
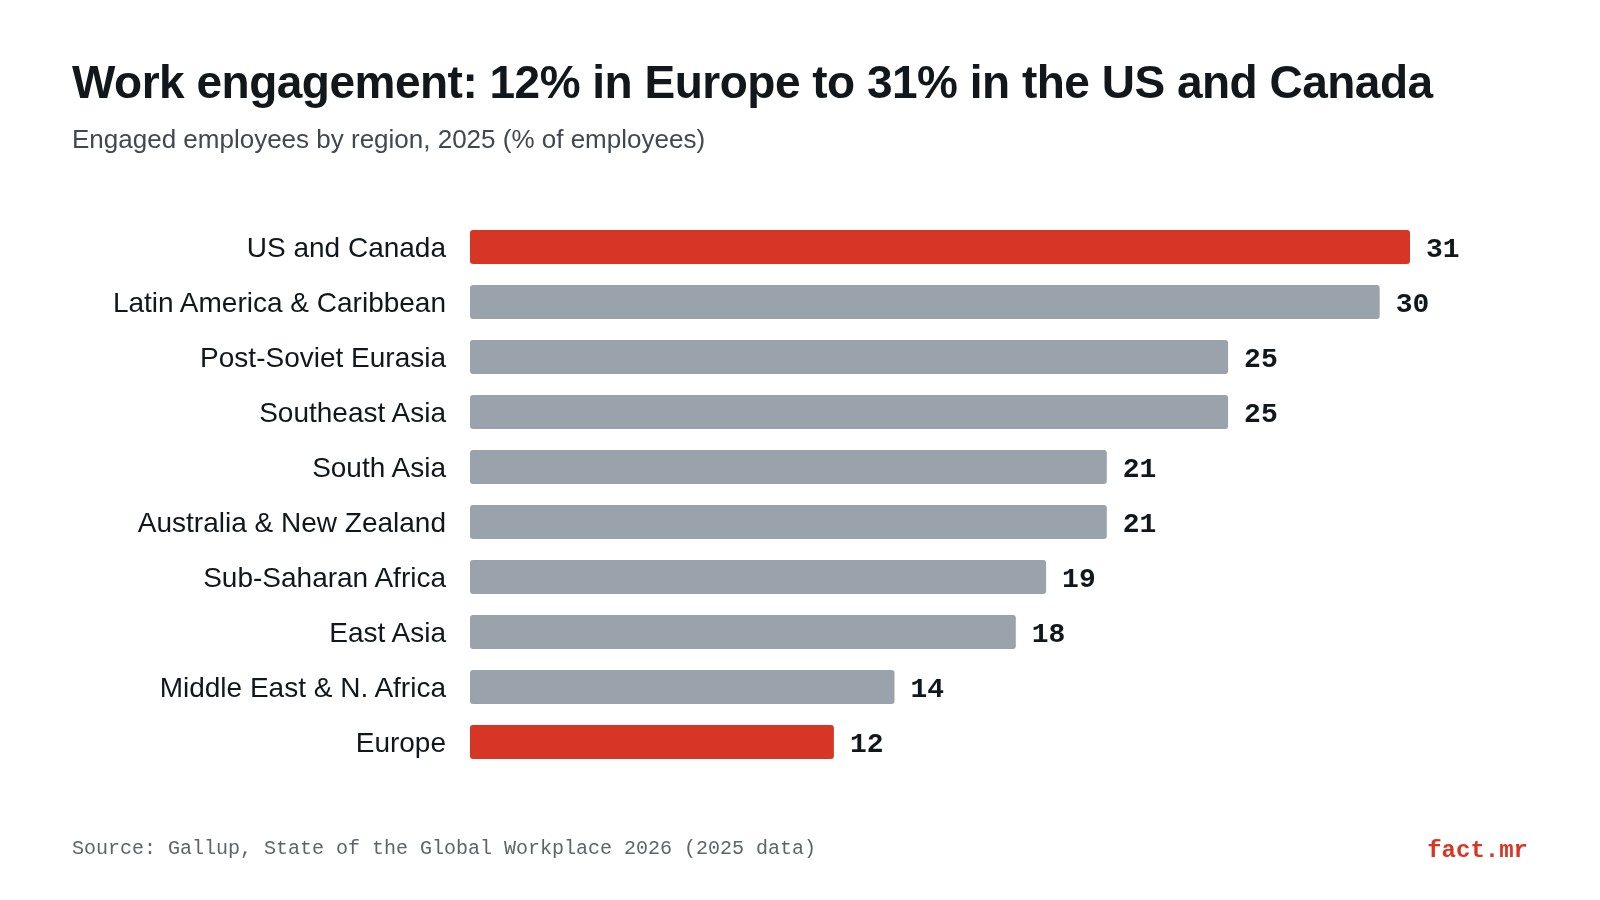
- In 2025 the US and Canada had the highest engagement of any region (31%) and Europe had the lowest (12%).
- No Gallup figure says which style is best. The data does show that meaningful weekly feedback from a manager nearly triples the percentage of engaged employees.
What a leadership style is
Any manager who sets goals and reviews results already has a style, whether they picked it on purpose or not. The label sums up their usual way of sharing decision power and of reacting when something goes wrong. Most managers mix several styles depending on the situation.
One common yardstick for a manager is how engaged their team is. Gallup defines employee engagement as a measure of "the psychological attachment workers have to their work, their team and their employer"1.
The main leadership styles, with examples
Autocratic
The manager decides alone and announces the order. Example: a warehouse shift supervisor who stops a conveyor line over a safety problem. It works in emergencies and with brand-new staff, but it wears people down once it becomes the default.
Democratic or participative
The team weighs in before anything is decided, and sometimes it votes. Example: a marketing department that chooses together the project management tool it will use next year. It slows things down when time is short.
Laissez-faire or delegative
The manager sets the goal and steps back. It suits specialists who know their task better than the manager does, such as a research lab. With inexperienced people it leaves gaps that nobody fills.
Transformational
This style rallies the team around a vision and around challenges that change how people work. Example: the owner who moves a small business from walk-in sales to e-commerce. Trouble starts when the vision never turns into concrete tasks.
Transactional
This style trades results for rewards: clear targets, then a bonus or a penalty depending on whether the targets are met. Think of a sales team with a monthly quota. It does well on measurable work and adds little when the job calls for invention.
Servant
The manager works for the team, clearing obstacles and making sure each person grows. Example: the support lead who takes the hardest tickets so everyone else can keep moving. Done well, it still means setting limits (the part plenty of servant leaders quietly skip).
Coaching
This style develops each person through frequent conversations and specific feedback. Of all the styles, it comes closest to something Gallup did measure: meaningful feedback every week nearly triples the percentage of engaged employees5. But in a Gallup study of nearly 15,000 employees, only 16% said their last conversation with their manager had been extremely meaningful5.
| Style | Who decides | Where it tends to fit | Common risk |
|---|---|---|---|
| Autocratic | The manager | Emergencies, new staff | A passive team |
| Democratic | The team with the manager | Decisions without a deadline | Slowness |
| Laissez-faire | The team | Experienced specialists | No direction |
| Transformational | The manager sets the vision | Business model changes | Reliance on charisma |
| Transactional | The manager sets targets and rewards | Measurable tasks | Little initiative |
| Servant | Shared | Support and service teams | No limits |
| Coaching | The individual, with guidance | Talent development | Takes a lot of the manager's time |
Find your style: which one fits your team
Start with how experienced the team is and how much a mistake would cost. When errors are expensive and the team is new, a directive style makes sense. When the team has mastered its work, delegating or coaching gives it more room.
Time is the other limit. Gallup reports that 97% of US managers have individual contributor work on top of leading others, and the median share of their time spent on that work is 40%5. And teams are getting bigger: the average number of people reporting to a US manager rose from 10.9 in 2024 to 12.1 in 2025, which is 1.2 more people.
Citing the Bureau of Labor Statistics, a Gallup article from January 2026 put the US ratio at roughly one manager for every 11.5 employees. The median team is smaller than the average, at about five to six employees per manager or leader, and 37% of managers or leaders oversee fewer than five people while 66% manage fewer than 10. At the other end, 22% have 10 to 24 direct reports and 13% oversee 25 or more5.

So does a bigger team doom engagement? Gallup's most recent meta-analysis on team size covered 92,252 teams across 104 organizations and 26 industries, with employees in 46 countries5. In a separate analysis of 44,025 responses, about seven in 10 employees were engaged when they strongly agreed that they had received meaningful feedback the previous week, whatever the size of their team. Among those who did not strongly agree, the share was one in four.
The same habit of agreeing on goals and checking in applies when the work leaves the company, as the guide on how to hire an SEO agency without getting burned shows for marketing.
How Gallup measures engagement
The instrument is called the Gallup Q12. Each employee rates the Q12 statements on six response options, from 5 = strongly agree to 1 = strongly disagree1. For the 2025 data, the sample was 263,810 respondents (141,444 of them employed), collected from January to December 2025 in more than 140 countries and territories across 10 regions.
The margin of sampling error for the global results ranges from ±0.05 to ±0.08 percentage points at the 95% confidence level2. Gallup typically surveys 1,000 people in each country or area. Each percentage point of engagement represents approximately 21 million employees.
Example: if 64% of employees worldwide are not engaged and 16% are actively disengaged, then 64% + 16% = 80% of employees were not engaged in 20252.
Gallup does not ask which leadership style each manager uses, so its figures cannot rank the styles.
What the data says about managers and engagement
The gap between regions is wide. In 2025, 19 percentage points separated the most engaged region from the least engaged one3.
| Region (Gallup) | Engaged employees, 2025 |
|---|---|
| United States and Canada | 31% |
| Latin America and the Caribbean | 30% (59% not engaged) |
| Post-Soviet Eurasia | 25% |
| Southeast Asia | 25% |
| South Asia | 21% |
| Australia and New Zealand | 21% |
| Sub-Saharan Africa | 19% |
| East Asia | 18% |
| Middle East and North Africa | 14% |
| Europe | 12% |
For a US reader, that lead comes with a catch. In the US and Canada, 50% of employees reported significant daily stress in 2025, the highest rate worldwide3. Only 47% of workers in the region said it was a good time to find a job, down from 70% in 20191, while the global figure was 52%2.
Gallup reports the US and Canada as a single region, so the regional table gives no figure for the US alone. Worldwide, engagement stood at 20% in 2025, down from its 2022 peak of 23%, though still eight points above the first measurement in 2009 and five points above a decade earlier1.
A 2015 Gallup study of 7,272 US adults gives the figure most often repeated about bosses: one in two had left a job to get away from their manager4. In another study from the same year, with 7,712 US adults, 67% of employees who strongly agreed that their manager focused on their strengths were engaged, against 31% when the manager focused on their weaknesses.
Managers are struggling too
Manager engagement has dropped nine points since 2022, and in 2025 South Asia had the steepest decline in manager engagement of any region, at eight points1. In organizations that Gallup classifies as best-practice, 79% of managers were engaged. Of the roles Gallup compared, leaders ranked highest in engagement (26%) and thriving (43%), yet they also report more negative emotions than everyone else.
| Emotion felt a lot the previous day | Leaders | Gap vs. individual contributors | All employees, world, 2025 |
|---|---|---|---|
| Stress | 46% | +7 points | 40% |
| Anger | 33% | +12 points | 22% |
| Sadness | 34% | +11 points | 23% |
| Loneliness | 31% | +10 points | 22% |
Engaged managers, leaders included, are 14 points more likely to be thriving in their overall life than the average leader1.
Work location and job level
Gallup found 2025 engagement of 30% among exclusively remote workers, 25% among hybrid workers, 24% among on-site workers whose jobs could be done remotely and 17% among on-site workers whose jobs could not2. That leaves 8 percentage points between hybrid and on-site, non-remote-capable employees, and the report does not link the gap to management style. Managers came in at 22% and individual contributors at 19%.
Common confusions
- Leadership vs. engagement. A style describes what the manager does. Engagement measures how the team responds.
- Laissez-faire vs. delegation. Delegating means agreeing on goals and following up. Laissez-faire done badly is just an absent manager.
- Transformational vs. transactional. They are often presented as opposites, but many managers use both: the vision to set direction and rewarded targets to run the day-to-day work.
- Regional data vs. national styles. Europe's 12% engagement does not prove that European managers use a worse style. The guide on how to read industry reports helps you avoid reading too much into figures like these.
Gallup estimated that low engagement cost the world economy approximately $10 trillion in lost productivity, or 9% of GDP1. It does not attribute that figure to any leadership style.
Frequently asked questions
What is the best leadership style?
No Gallup series ranks the styles from best to worst. Gallup measures a practice instead: meaningful weekly feedback from a manager nearly triples the percentage of engaged employees. That practice belongs to the coaching style, although any manager can adopt it.
How much does a manager affect team engagement?
A 2015 Gallup article based on US data found that managers account for at least 70% of the variance in employee engagement scores. In the same article, one in two US adults surveyed said they had left a job to get away from their manager.
What percentage of US employees are engaged?
Gallup reports the US and Canada together. In 2025, 31% of employees in that region were engaged, among the highest rates in the world and well above the global average of 20%. The same region had the world's highest rate of daily stress, at 50%.
What is the difference between transformational and transactional leadership?
Transformational leaders rally the team around a vision and new challenges. Transactional leaders trade results for rewards, such as a bonus for hitting a quota. Gallup does not compare the two styles, but it did find that manager engagement fell from 27% to 22% between 2024 and 2025.
Sources
- Gallup, "State of the Global Workplace 2026 | Employee Engagement Data & Trends" (2026 edition). Global engagement in 2025 and its trend since 2009, definition of engagement, Q12 method, sample, engagement and emotions of managers and leaders, US and Canada job market outlook, estimated cost of low engagement. gallup.com. Accessed Oct 20, 2026.
- Gallup, "State of the Global Workplace | 2026 Global Data Summary" (2026 edition). Not engaged and actively disengaged employees, previous-day emotions, engagement by work location and job level, global job market outlook, margin of error, sample per country. gallup.com. Accessed Oct 20, 2026.
- Gallup, "State of the Global Workplace | 2026 Regional and Country Data" (2026 edition). Engagement by region in 2025, daily stress in the US and Canada. gallup.com. Accessed Oct 20, 2026.
- Gallup, "Employees Want a Lot More From Their Managers" (2015). Managers' share of the variance in engagement, employees who left a job because of their manager, focus on strengths. gallup.com. Accessed Oct 20, 2026.
- Gallup, "Span of Control: What's the Optimal Team Size for Managers?" (2026). Direct reports per US manager, Bureau of Labor Statistics manager ratio, individual contributor work, weekly feedback and the team-size meta-analysis. gallup.com. Accessed Oct 20, 2026.
Chart: our own, with data from Gallup, State of the Global Workplace 2026 (source 3).
Photo: Breather breather (CC0, Wikimedia Commons).
fact.mr is not affiliated with consulting firms with similar names.
Found an error? Write to us at [email protected].