Six sigma: what 3.4 defects per million means, how to read the sigma table and the DMAIC steps
Six sigma means about 3.4 defects per million opportunities, per the EPA. See the sigma table built from NIST normal distribution data, the five DMAIC phases and a worked hospital example.
In this article
Six sigma is a set of statistical methods for analyzing processes and cutting their variation. The term also names a quality level: according to the U.S. Environmental Protection Agency (EPA), a six sigma process produces approximately 3.4 defects per million opportunities1. Projects typically run on DMAIC, a five-phase cycle: define, measure, analyze, improve and control.
Key points
- Sigma is the Greek letter for standard deviation. The EPA puts a six sigma quality level at about 3.4 defects per million opportunities2.
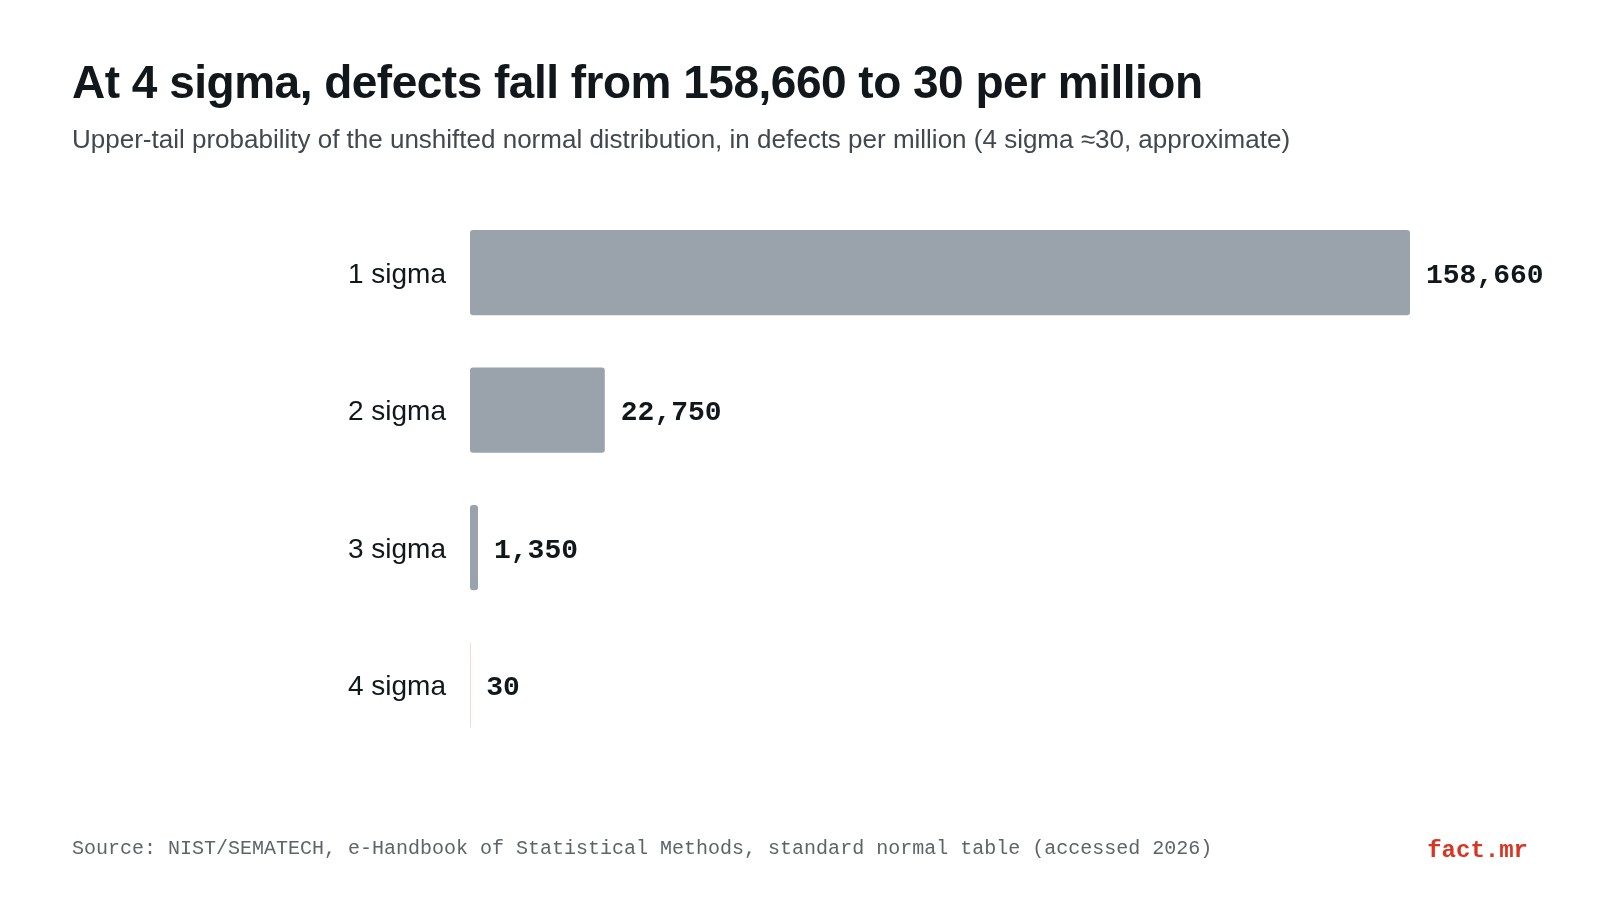
- For a centered normal distribution, the NIST table leaves 158,660 cases per million beyond 1 sigma, 22,750 beyond 2, 1,350 beyond 3 and about 30 beyond 44.
- Motorola dates the invention to 1986. General Electric adopted the method in 1995, under CEO Jack Welch2.
- The EPA says a DMAIC project can take several months to a year or more, with teams of five to ten people2.
- At an Italian rehabilitation hospital, infection cases fell from 169 to 121 after a Lean Six Sigma project run with DMAIC6.
What six sigma is and where it comes from
The EPA's guide for environmental professionals describes it as a set of well-established statistical quality control techniques and data analysis methods for finding and reducing variation in products and processes2. Sigma is the Greek letter that stands for the standard deviation of a statistical population. The more standard deviations fit between a process mean and the limit that separates a good part from a bad one, the fewer defects come off the line.
The sources disagree on the date of origin.
Motorola, which Paul V. Galvin and his brother Joseph incorporated in Chicago on September 25, 1928, as Galvin Manufacturing Corporation, says in its corporate timeline that it invented six sigma in 1986 and that the method became a common worldwide language for measuring quality3. The EPA's Lean Thinking page places the development in the 1990s1. The agency's Chapter 3 guide traces the techniques back to the 1920s, says they were not widely used for quality control until the late 1980s and ties them to the years when Bob Galvin was Motorola's chairman2.
The 1995 date is less disputed: that year Jack Welch, then CEO of General Electric, built six sigma techniques into the company's business strategy2. The belt vocabulary comes from martial arts rankings, according to the same EPA guide. Green belts, for instance, are employees who take on six sigma work alongside their regular jobs and lead the less complex projects.
How to read the sigma level table
The table comes straight from the normal distribution. NIST's e-Handbook of Statistical Methods lists the area under the curve between 0 and each value of z. Subtract that area from 0.5 and you get the share left in the upper tail; multiply by one million and you have defects per million opportunities (DPMO)4.
| Sigma level (z) | Area from 0 to z (NIST) | Upper tail | Defects per million |
|---|---|---|---|
| 1 | 0.34134 | 0.15866 | 158,660 |
| 2 | 0.47725 | 0.02275 | 22,750 |
| 3 | 0.49865 | 0.00135 | 1,350 |
| 4 | 0.49997 | 0.00003 | ≈30 |
| Six sigma (EPA convention) | n/a | n/a | 3.4 |
The 4 sigma row is approximate (the NIST table only carries five decimals, which runs out of room right there). Above 4, the table can't support this calculation.
So where does 3.4 come from? The EPA gives the figure without saying which convention produces it. The table rows describe a perfectly centered process and a single tail, and NIST warns on its process capability page that its reject figures assume a distribution centered on the mean5.
But real processes drift, and when the mean slides off center one of the two tails grows.
The link to process capability
NIST defines process capability as a comparison between the output of an in-control process and its specification limits, made with capability indices5. The Cp index divides the width of the specification by the width of the process, measured as 6 standard deviations. In the NIST table, a Cp of 1.00 matches 0.27% rejects, and a Cp of 2.00 matches 2 ppb (parts per billion).
The five phases of DMAIC
The EPA presents DMAIC as the five-step process typically used to apply six sigma and compares it to the Plan-Do-Check-Act (PDCA) improvement cycle2.
- Define. The team writes the problem statement, including project goals and the issues to resolve.
- Measure. Metrics are set to get baseline data on process performance and pinpoint problem areas.
- Analyze. The team identifies the root causes of quality problems and confirms them with statistical tools. A common way to sort the hypotheses is the Ishikawa, or fishbone, diagram, which groups causes into six areas: materials, machine, method, people, measurement and environment.
- Improve. The team puts solutions to the identified problems into practice.
- Control. The improved system becomes standard through changes to policies, procedures and other management systems.
For the measure phase, NIST offers a practical benchmark: a sample "large enough" to estimate capability indices is generally about 50 independent data values5. And the work is slow. The EPA says getting through DMAIC can take several months or up to a year or more, with five to ten team members drawn from inside and outside the process2.
Worked example: infections at a rehabilitation hospital
The Maugeri Institute in Cassano delle Murge, Italy, used Lean Six Sigma and DMAIC to reduce healthcare-associated infections and introduced corrective measures in 2017. The study, available on PubMed Central, analyzed 2,415 patients across two periods, one before the new protocol and one after6.
| Indicator | Before (Nov 2017 to Jun 2018) | After (Nov 2018 to Jun 2019) |
|---|---|---|
| Patients | 1,278 | 1,137 |
| Infection cases | 169 | 121 |
| Infection rate (cases / patients) | 13.2% | 10.6% |
Example calculation: 169 cases among 1,278 patients gives a 13.2% rate, and 121 among 1,137 gives 10.6%. That is 48 fewer cases, a 28.4% relative drop in the case count. The authors report an overall decrease of 3.44%, which matches neither of the other two figures, so anyone citing the study should say which of the three numbers they mean.
What sigma level does that process reach? If each patient counts as one defect opportunity, a 13.2% rate sits below the 1 sigma tail (158,660 per million) and well above the 2 sigma tail (22,750 per million). Before and after the change, the hospital lands between 1 and 2 sigma under the centered convention, a long way from 3.4 defects per million.
That reading depends on how opportunities are defined; it is an example built from the table above, not a figure taken from the study.
The project reported total savings of 448,000 euros: 90,000 in drugs, 30,000 in devices and 328,000 in staff costs6. Length of stay for infected patients fell most in Cardiology, by 7 days. That unit has 40 beds, against 54 in Neurorehabilitation and 67 in Functional Rehabilitation.
A second published example: NIST's Cpk
The NIST e-Handbook works through a case with an upper specification limit of 20, a lower limit of 8, a mean of 16 and a standard deviation of 2. Cpk comes out at 0.6667, the smaller of Cpu (0.6667) and Cpl (1.3333), because the mean sits closer to the upper limit5. NIST wants a Cpk of at least 1.0, calls this one not a good process and recommends reducing the variability or centering the process if possible.
Lean six sigma: how the two fit together
The U.S. Army defines Lean Six Sigma as a process improvement methodology focused on eliminating waste and reducing variation7. Lean handles the waste; six sigma handles the variation. Their tempos differ sharply: per the EPA, a lean kaizen event lasts a week, while a DMAIC project runs for months2.
The Army recognized eight organizations as its top Lean Six Sigma implementers of 2015, with about $1.1 billion in combined savings or cost avoidance, at a Sept. 14 ceremony in the Pentagon's Hall of Heroes (the article ran on Sept. 30, 2016). At Corpus Christi Army Depot, a project on the AH-64 Apache turret flange saved $6.9 million, cut labor costs by 89% and reduced process lead time by 78%. A second Corpus Christi project, on product quality deficiency reports, brought defects down from 57% to 10% and saved $7 million over three years7.
The pairing has critics. The EPA notes that some lean experts see six sigma, as some organizations implement it, as contradictory to lean principles1. For methods built on short cycles instead of year-long projects, compare it with agile and Scrum.
When it works and when it doesn't
The EPA observes that six sigma methods are most often used by larger organizations and by those willing to devote resources and talent to statistical capability1. For a small business, that is a cost to plan for. The agency also warns that a lack of technical capacity to use the tools can reduce the method's effectiveness and create unexpected waste, so training belongs in the business plan.
It fits best on repetitive processes with a countable defect and data to measure it. The Pareto principle the EPA cites helps pick a starting point: most quality problems come from a "vital few" processes.
Common mix-ups
- Six sigma and the Cp index. Cp measures process width as 6 standard deviations, yet a Cp of 1.00 matches 0.27% rejects, nowhere near 3.4 per million.
- Six sigma and lean. Lean targets waste and six sigma targets variation. Lean Six Sigma runs both as one program.
- DMAIC and PDCA. The EPA calls them similar. DMAIC gives baseline measurement and statistical root-cause analysis phases of their own.
- Belts and sigma levels. Belts are project roles named after martial arts ranks. The sigma level describes the process, never the person.
The NIST table offers no precision past 4 sigma, and the EPA page cited here gives its 3.4 defects per million without the calculation behind it.
Frequently asked questions
What does six sigma mean in numbers?
According to the EPA, a six sigma quality level equals approximately 3.4 defects per million opportunities. Sigma is the process standard deviation. For reference, the NIST normal table leaves 1,350 cases per million in the upper tail at 3 sigma and about 30 at 4 sigma, always with the process centered on its mean.
What does DMAIC stand for?
Define, Measure, Analyze, Improve and Control, the five phases of the method. The EPA compares it to the PDCA cycle and says a project can take several months to a year or more, with teams of five to ten people.
Who invented six sigma?
Motorola. Its official timeline dates the invention to 1986, one EPA page places it in the 1990s and another links it to Bob Galvin's time as chairman. General Electric adopted it in 1995, when Jack Welch was CEO, and Motorola Solutions says it became a global standard.
How do you calculate DPMO?
Divide the defects by the defect opportunities and multiply the result by one million. In the Maugeri Institute study there were 121 infections among 1,137 patients after the change, a 10.6% rate. If each patient counts as one opportunity, that falls between the 1 and 2 sigma levels in the table.
Sources
- US EPA, "Lean Thinking and Methods - Six Sigma" (n.d.). Definition, 3.4 defects per million, 1990s origin, use by organization size, criticism from lean experts, limitations and the Pareto principle. epa.gov. Accessed Nov 3, 2026.
- US EPA, "Environmental Professional's Guide to Lean and Six Sigma: Chapter 3" (n.d.). Definition, meaning of sigma, historical background, Bob Galvin, General Electric adoption, DMAIC phases, roles, team size, project length and the Ishikawa diagram. epa.gov. Accessed Nov 3, 2026.
- Motorola Solutions, "Timeline" (n.d.). Company founding, year six sigma was invented and its role as a global standard. motorolasolutions.com. Accessed Nov 3, 2026.
- NIST/SEMATECH, e-Handbook of Statistical Methods, "Cumulative Distribution Function of the Standard Normal Distribution" (n.d.). Areas under the normal curve used for the sigma level table and the chart. itl.nist.gov. Accessed Nov 3, 2026.
- NIST/SEMATECH, e-Handbook of Statistical Methods, "What is Process Capability?" (n.d.). Process capability, the Cp index, sample size and the Cpk example. itl.nist.gov. Accessed Nov 3, 2026.
- PubMed Central, "Reducing the Healthcare-Associated Infections in a Rehabilitation Hospital under the Guidance of Lean Six Sigma and DMAIC" (n.d.). Patients, infection cases, length of stay, beds and savings at the Maugeri Institute. pmc.ncbi.nlm.nih.gov. Accessed Nov 3, 2026.
- U.S. Army, "Lean Six Sigma Process Reaps Big Award For Corpus Christi depot" (2016). Definition of Lean Six Sigma, recognized organizations, savings and results of the Corpus Christi projects. army.mil. Accessed Nov 3, 2026.
Chart: our own, with data from NIST/SEMATECH, e-Handbook of Statistical Methods (source 4).
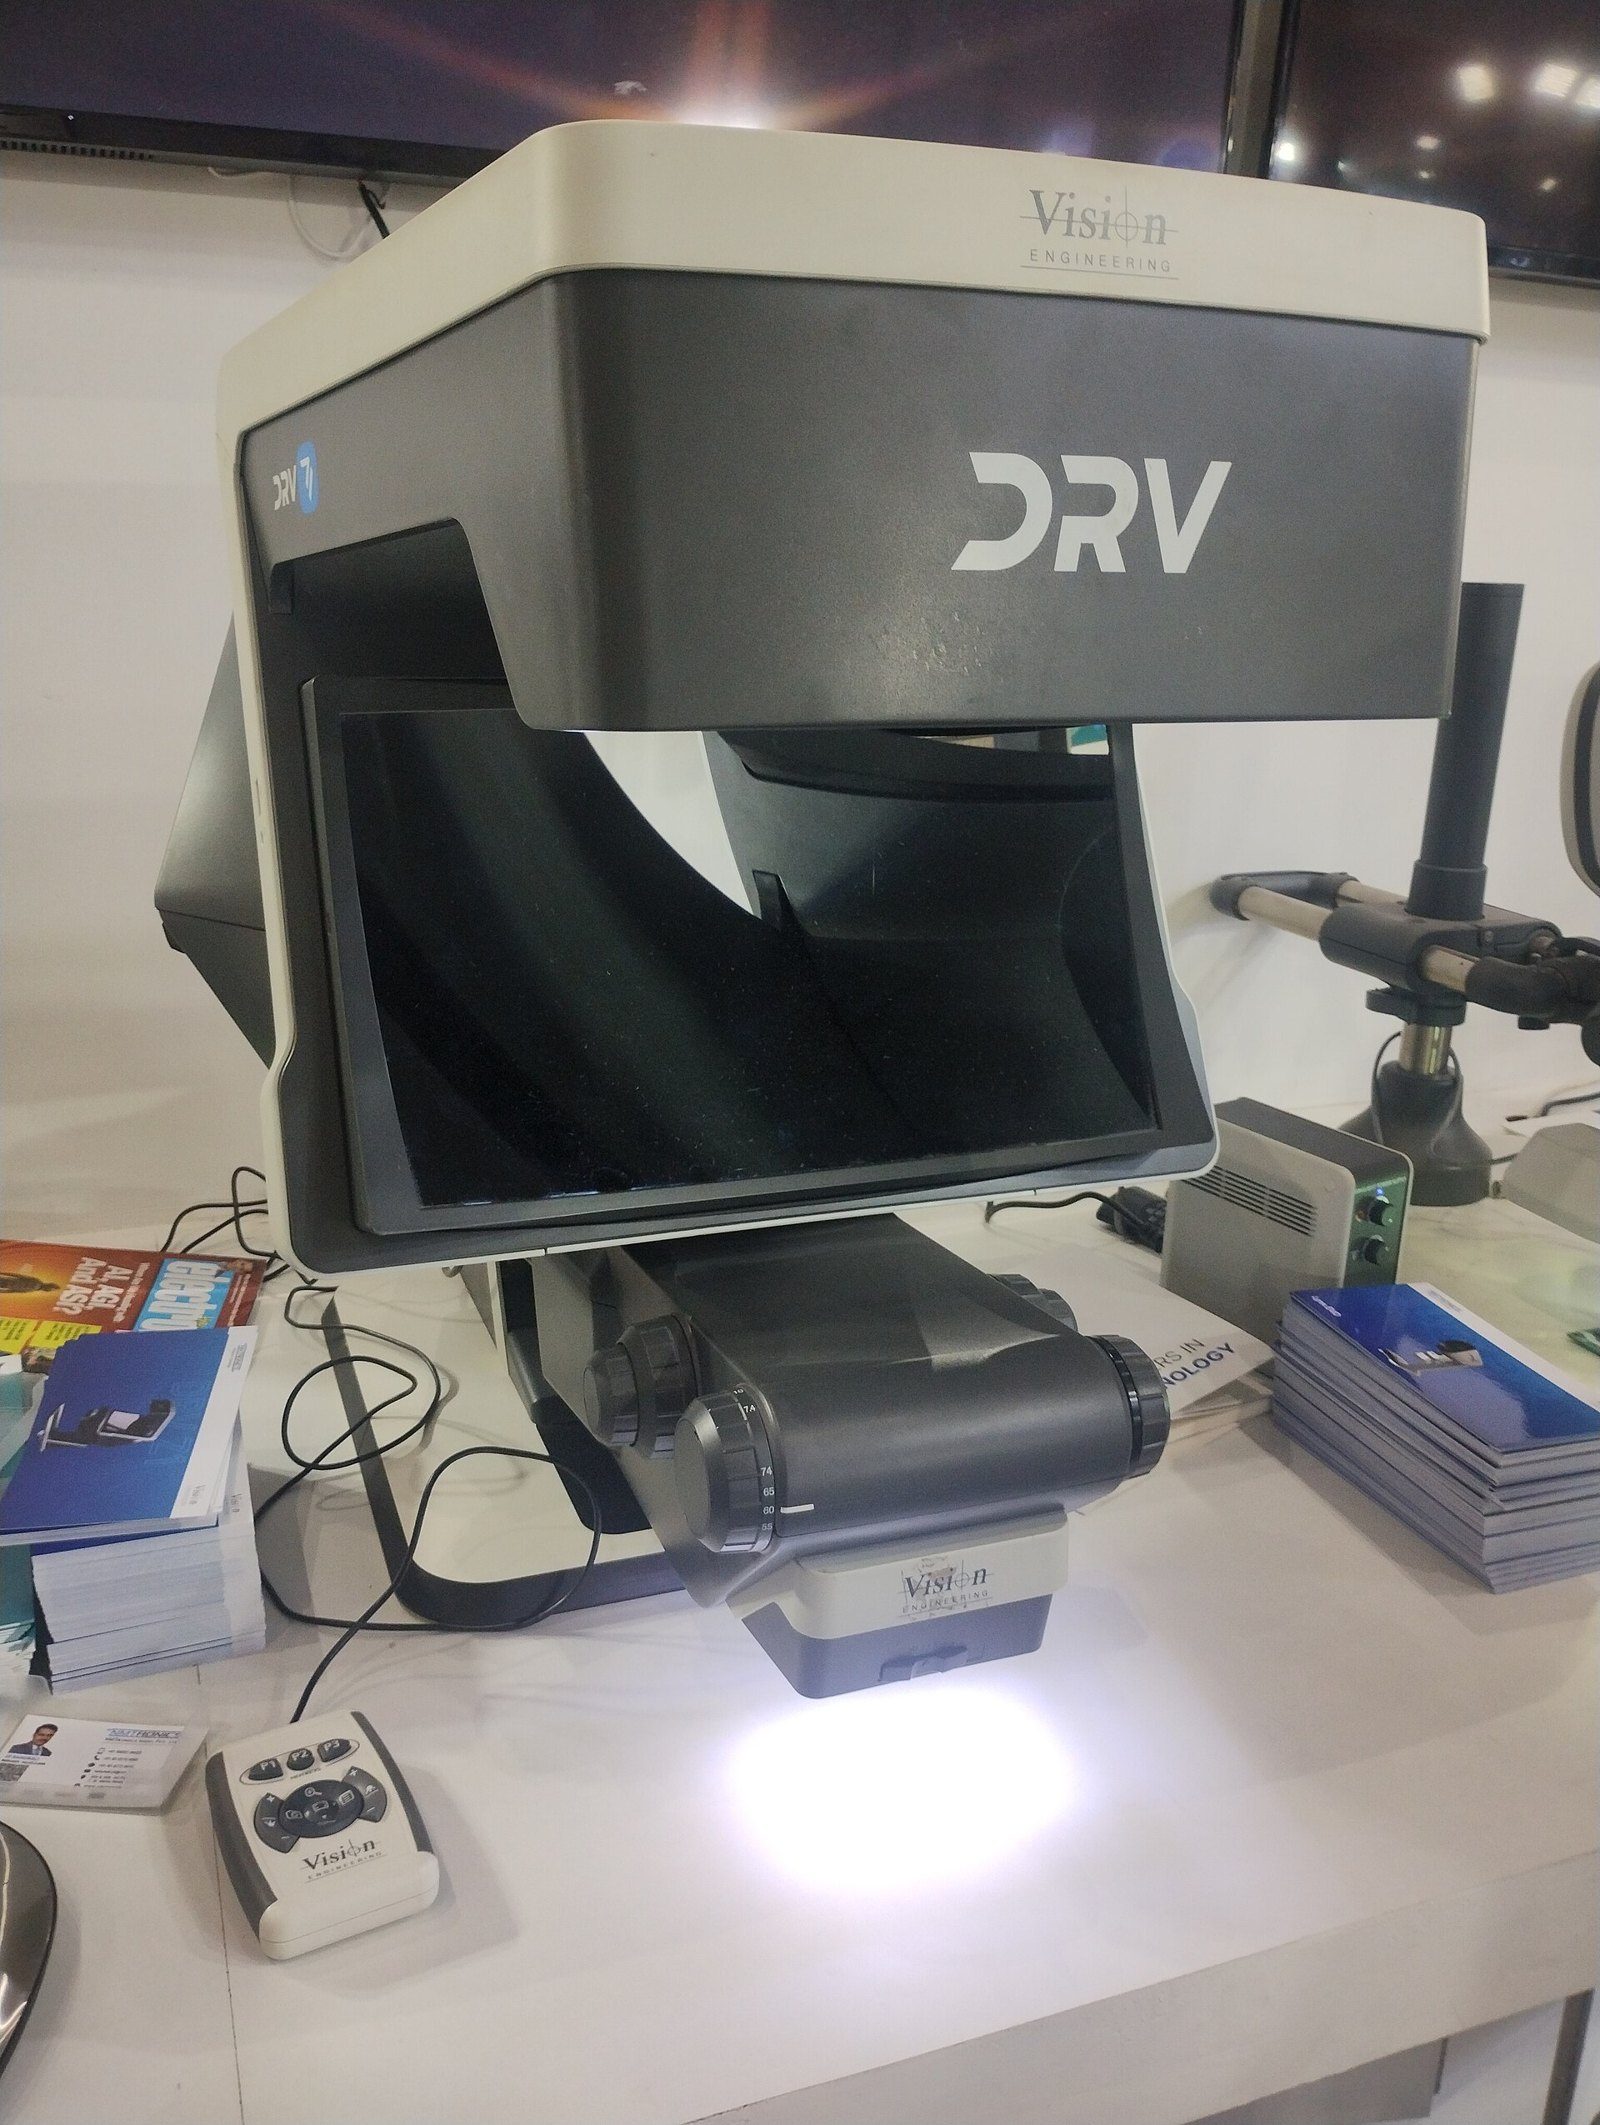
Photo: Gpkp (CC BY-SA 4.0, Wikimedia Commons).
fact.mr is not affiliated with consulting firms with similar names.
Found an error? Write to us at [email protected].