Market report
Managed network services: what they are, who provides them and official figures
Managed network services explained: what an MSP runs, plus Census data showing U.S. computer systems design revenue of $195,524 million in Q2 2026.
Managed network services are network operations that a company hands to an outside firm, usually called a managed service provider (MSP). Under contract, that firm runs the LAN, the WAN or SD-WAN links between sites, the Wi-Fi and the security controls on the traffic. No official statistic measures this market by name, but the closest U.S. proxy is NAICS 5415, computer systems design and related services, whose taxable establishments reported $195,524 million in revenue in the second quarter of 2026, according to the U.S. Census Bureau's Quarterly Services Survey1.
Key points
- An MSP runs a client's network under contract: local network, wide area links or SD-WAN, Wi-Fi and network security, usually monitored from a network operations center.
- The Census Bureau's Quarterly Services Survey puts revenue of taxable U.S. computer systems design establishments (NAICS 5415) at $195,524 million in Q2 2026, not seasonally adjusted.
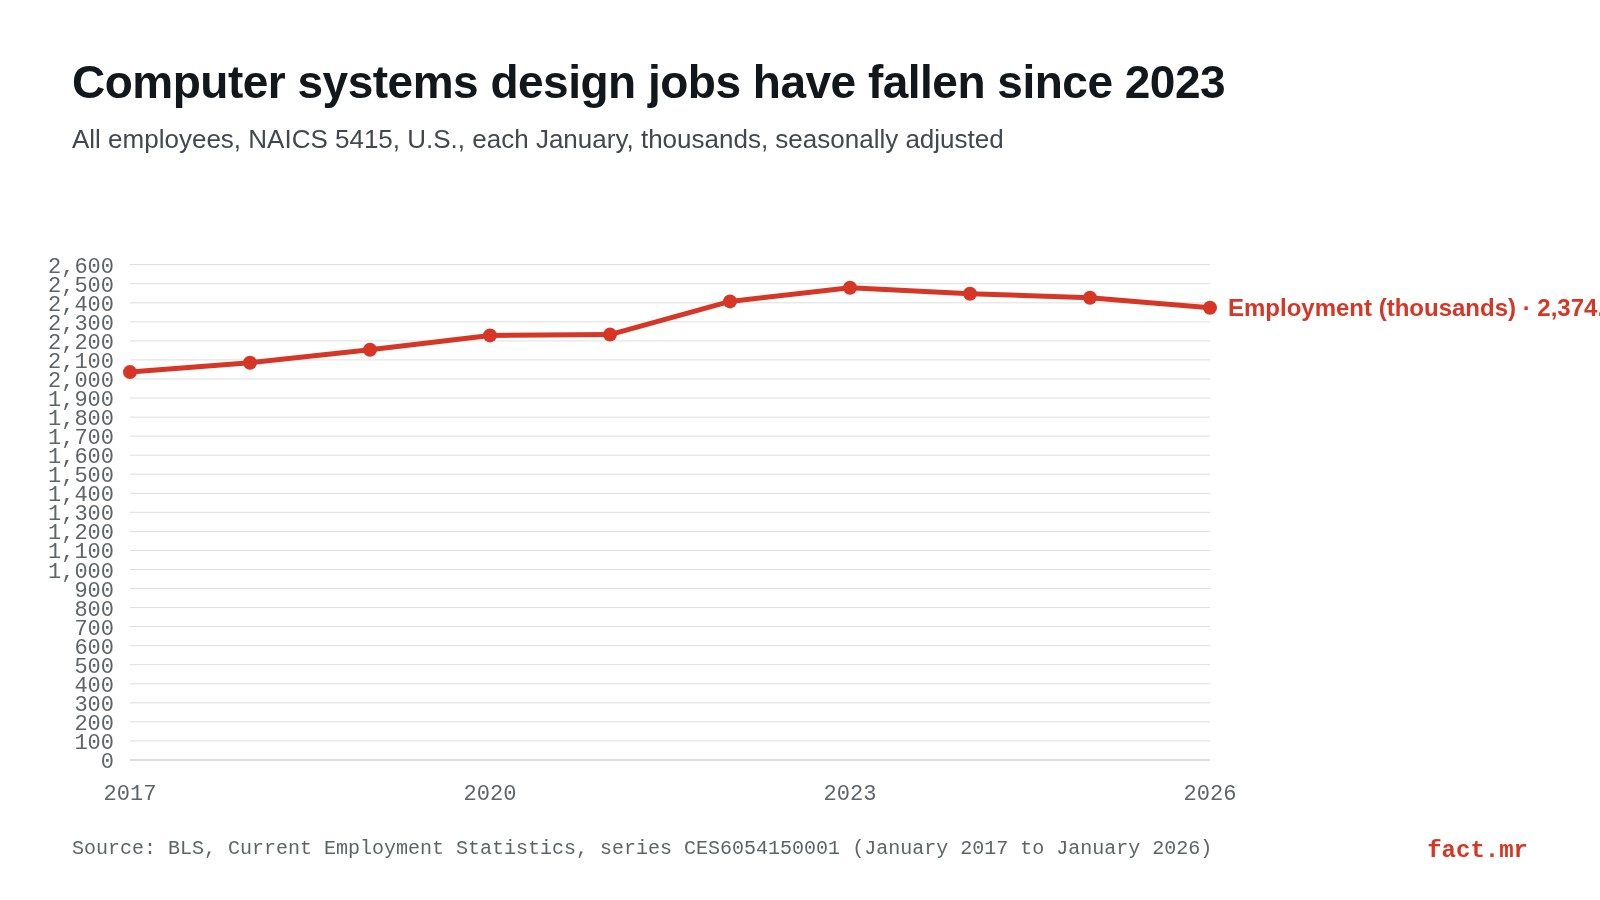
- BLS counted 2,374.2 thousand employees in that industry in January 2026, which is 104.4 thousand fewer than in January 2023. The preliminary figure for September 2026 is 2,355.4 thousand.
- Eurostat found that 92.76% of EU enterprises used at least one ICT security measure in 2024, while only 65.43% used network access control.
- BLS projects that employment of network and computer systems administrators will decline 4 percent from 2025 to 2035.
What managed network services are
The contract covers infrastructure a company uses every hour and rarely thinks about until it fails. A provider takes over the local area network inside each office and the wide area links that connect branches, data centers and cloud workloads, which can be run as software-defined WAN (SD-WAN). It also takes the Wi-Fi access points and the security controls on that traffic, such as firewalls, VPN gateways and network access control, in exchange for a recurring fee tied to a service-level agreement.
What changes hands
The scope varies by contract. A typical managed network deal moves these tasks from the client's IT team to the provider:
- Design and rollout of the network, including hardware selection and site surveys for Wi-Fi.
- Continuous monitoring, alerting and first response to outages, from the provider's operations center.
- Configuration changes, firmware updates and patching of routers, switches and firewalls.
- Security policy on the network: who can connect, through which VPN, with which authentication.
- Reporting against the service-level agreement.

The in-house alternative
U.S. labor statistics have a name for the job an MSP replaces. The BLS Occupational Outlook Handbook describes network and computer systems administrators as the people who install, configure and maintain organizations' computer networks and systems. It lists computer systems design firms among their employers, along with schools and financial institutions4.
So some of the administrators who keep a given company's network running are paid by a provider and not by the company that uses the network. When a CFO weighs a monthly MSP invoice against a hire, the reference point the BLS publishes is a median annual wage of $99,130 for the occupation in May 2025. The same handbook projects that employment in the occupation will decline 4 percent from 2025 to 2035, with about 13,400 openings a year on average over the decade.
How big is the managed network services market?
No statistical agency publishes a line called "managed network services." (The large figures at the top of search results come from paid consultancy reports, which define the category in different ways and don't agree with each other, so this page doesn't use them.) What official sources do publish is data on the industry that sells this work, and a guide on how to read industry reports without getting manipulated explains why that distinction matters.
Revenue: the Census Bureau's Quarterly Services Survey
The Quarterly Services Survey provides estimates of revenue and expenses for selected service industries, and NAICS 5415 is one of them. In the second quarter of 2026, taxable establishments in computer systems design and related services reported total revenue of $195,524 million, not seasonally adjusted. That figure comes from the U.S. Census Bureau as distributed by FRED, the St. Louis Fed's database1.
FRED holds 91 quarterly data points for the series, from the fourth quarter of 2003 to the second quarter of 2026. The most recent edition is the Census Bureau's Quarterly Services Report for the 2nd Quarter 2026, and the survey's historical data page was last revised on September 9, 20262.
But that number covers the whole industry code. It includes every kind of work classified under NAICS 5415, and the series doesn't separate out the revenue that comes from running clients' networks.
Employment: the BLS payroll count
Each month the BLS Current Employment Statistics survey counts all employees in computer systems design and related services, in thousands and seasonally adjusted, as series CES60541500013. The January readings rise every year through 2023, then fall in each of the next three.
| Month | Employees, NAICS 5415 (thousands, seasonally adjusted) |
|---|---|
| January 2016 | 1,957.2 |
| January 2017 | 2,036.1 |
| January 2018 | 2,085.2 |
| January 2019 | 2,153.6 |
| January 2020 | 2,228.5 |
| January 2021 | 2,232.6 |
| January 2022 | 2,406.9 |
| January 2023 | 2,478.6 |
| January 2024 | 2,446.9 |
| January 2025 | 2,426.3 |
| January 2026 | 2,374.2 |
| September 2026 (preliminary) | 2,355.4 |
January 2023 has the highest value in the table. Between that month and January 2026 the industry had 104.4 thousand fewer employees, and compared with January 2022 it was down 32.7 thousand. The preliminary September 2026 reading, 2,355.4 thousand, is lower still.
The BLS series records the drop but doesn't explain it.
What European companies already do on network security
Eurostat's survey on ICT usage and e-commerce in enterprises covered some 157,000 companies with 10 or more employees or self-employed persons, out of 1.54 million in the EU5. The agency defines ICT security as relevant incidents and the measures, controls and procedures that enterprises apply to keep their data and ICT systems intact, confidential and available. In 2024, 92.76% of EU enterprises used at least one such measure.
| ICT security measure (EU, 2024) | Share of enterprises |
|---|---|
| At least one ICT security measure | 92.76% |
| Strong password authentication | 83.69% |
| Data backup to a separate location or cloud | 79.23% |
| Network access control | 65.43% |
| Virtual private networks (VPN) | 49.64% |
| Log files kept for analysis after security incidents | 45.16% |
| Combination of 2 or more authentication mechanisms | 39.84% |
| Encryption of data, documents or e-mails | 39.72% |
| ICT security tests | 34.64% |
| ICT risk assessments | 34.10% |
| Biometric authentication | 18.27% |
The rows near the bottom of the table are the kinds of tasks a managed network or security provider can sell as add-ons. Fewer than half of EU enterprises kept log files for post-incident analysis (45.16%), and 34.64% ran ICT security tests. VPN use reached 49.64%.
Small companies trail on the basics
For a provider, the people deciding whether to outsource their network are mostly running small firms. According to Eurostat, small enterprises make up approximately 83% of the 1.54 million EU companies with 10 or more people, and their adoption of strong password authentication is the lowest of the three size classes.
| Size class (persons employed) | Share of EU enterprises | Use strong password authentication, 2024 |
|---|---|---|
| Small (10-49) | approx. 83% | 82.03% |
| Medium (50-249) | 14% | 90.66% |
| Large (250 or more) | 3% | 96.78% |
Incidents: failures more than attacks
In 2023, 21.54% of EU enterprises suffered some consequence from an ICT security incident, Eurostat reports. ICT services went down because of hardware or software failures at 17.97% of enterprises, compared with 3.43% that reported unavailability from an outside attack such as ransomware or denial of service. For anyone pricing a monitoring contract, that ratio is a better guide than a vendor's threat brochure, because uptime problems in the data mostly came from equipment and code.
Written policies, by country
Only 35.50% of EU enterprises had documents setting out ICT security measures, practices or procedures in 2024. The gap between countries is wide:
| Country | Enterprises with ICT security documents, 2024 |
|---|---|
| Finland | 59.41% |
| Denmark | 59.11% |
| Portugal | 54.29% |
| EU | 35.50% |
| Greece | 18.28% |
| Hungary | 13.75% |
| Bulgaria | 13.67% |
A larger share, 59.97%, told staff about their obligations on ICT security matters. The regulatory starting point is the NIS Directive, the first EU-wide cybersecurity legislation, which the European Parliament adopted on July 6, 2016 and which entered into force in August 2016.
Spain: where the telecom figures live
Readers in Spain who are comparing operators that sell managed connectivity can look to the National Markets and Competition Commission (CNMC). It publishes quarterly telecom statistics on its CNMC Data portal, including a dataset titled Telecomunicaciones Trimestral Mercados de 2025 a 2029 (quarterly telecom markets, 2025 to 2029)6. The portal page doesn't say whether an operator's managed network contracts are counted as connectivity revenue, as IT services or in neither category.
Terms that get mixed up
Managed network services and managed security services
A managed security service provider (MSSP) focuses on threat detection and response, often from a security operations center (SOC). A managed network contract centers on availability and performance, and security is one layer within it. Many providers sell both, so the contract scope matters more than the label.
Network as a service (NaaS)
NaaS is a way of paying. The client pays a subscription or usage fee that includes the hardware, so it doesn't buy routers and access points and then pay someone to run them. A managed network can be sold as NaaS or on top of equipment the client already owns.
NOC and SOC
A network operations center watches link status, latency and device health, while a security operations center watches for malicious activity. Monitoring tools for both have their own market story, covered in a piece on the expansion of infrastructure monitoring.
SD-WAN and MPLS
MPLS is a private wide area service that a carrier provides over its own network. SD-WAN is software that steers traffic across several links, including ordinary internet connections, under central policy. A managed WAN contract can include moving a client from MPLS to SD-WAN.
What the proxy data leaves out
Every official figure on this page measures a larger whole: an industry code, an occupation or a security practice. Can a buyer use them to size the managed network services market? Not directly. The Census Bureau's $195,524 million for Q2 2026 covers every taxable establishment in NAICS 5415, and none of the public series here separates the part of that revenue that pays for running other companies' networks.
Frequently asked questions
What are managed network services?
They are network operations a company contracts out to a managed service provider. That covers the LAN, the WAN or SD-WAN links, Wi-Fi and network security, monitored from the provider's operations center for a recurring fee. In U.S. statistics, the closest industry code for the firms that sell this work is NAICS 5415, computer systems design and related services.
How big is the managed network services market?
No official series measures it by name. Taxable establishments in the nearest U.S. proxy, NAICS 5415, reported $195,524 million in revenue in the second quarter of 2026 (Census Bureau, not seasonally adjusted). According to the BLS, the industry had 2,374.2 thousand employees in January 2026 and a preliminary 2,355.4 thousand in September 2026.
How many European companies control access to their networks?
Eurostat found that 65.43% of EU enterprises used network access control in 2024 and 49.64% used VPNs. Smaller firms trail on basic measures: 82.03% of small enterprises used strong password authentication, compared with 96.78% of large ones. Small firms make up approximately 83% of EU companies with 10 or more people.
Are network administrator jobs growing in the U.S.?
No, according to the official projection. The BLS projects that employment of network and computer systems administrators will decline 4 percent from 2025 to 2035, with about 13,400 openings a year on average over the decade. The median annual wage for the occupation was $99,130 in May 2025, and computer systems design firms are among its employers.
Sources
- U.S. Census Bureau via FRED (Federal Reserve Bank of St. Louis), "Total Revenue for 5415: Computer Systems Design and Related Services, Establishments Subject to Federal Income Tax (REV5415TAXABL144QNSA)" (Q2 2026). Quarterly revenue for NAICS 5415, the range of the series and its number of data points. fred.stlouisfed.org. Accessed Oct 23, 2026.
- U.S. Census Bureau, "Quarterly Services - Historical Data" (last revised September 9, 2026). Latest Quarterly Services Report edition and the revision date. census.gov. Accessed Oct 23, 2026.
- U.S. Bureau of Labor Statistics, "Current Employment Statistics, series CES6054150001" (data through September 2026, preliminary). Employment in computer systems design and related services, January 2016 to September 2026. data.bls.gov. Accessed Oct 23, 2026.
- U.S. Bureau of Labor Statistics, "Network and Computer Systems Administrators," Occupational Outlook Handbook (2025 to 2035 projections). Duties, employers, median wage, employment projection and annual openings. bls.gov. Accessed Oct 23, 2026.
- Eurostat, "ICT security in enterprises," Statistics Explained (2024 survey). Security measures, incidents in 2023, results by company size and country, survey sample and the NIS Directive dates. ec.europa.eu. Accessed Oct 23, 2026.
- CNMC, "CNMC Data: datos trimestrales de telecomunicaciones" (2026). Quarterly telecom market datasets for Spain. data.cnmc.es. Accessed Oct 23, 2026.
Chart: our own, with data from BLS, Current Employment Statistics, series CES6054150001 (source 3).
Photo: Alan Levine from United States (CC BY 2.0, Wikimedia Commons).
fact.mr is not affiliated with consulting firms with similar names.
Found an error? Write to us at [email protected].
Related reports
Sales Engagement Software Market Size, Share & Forecast 2026-2032
33.5 USD bn
Estimated market size in 2032
- 2026
- 13.8 USD bn
- Forecast period
- 2026–2032
Connected Home Market Size, Share & Forecast 2026-2032
234.3 USD bn
Estimated market size in 2032
- 2026
- 115.0 USD bn
- Forecast period
- 2026–2032
Electronic Shelf Label Market Size, Share & Forecast 2026-2032
5.50 USD bn
Estimated market size in 2032
- 2026
- 2.75 USD bn
- Forecast period
- 2026–2032