Busiest and Biggest Airports in the US, Ranked by Passengers and Size
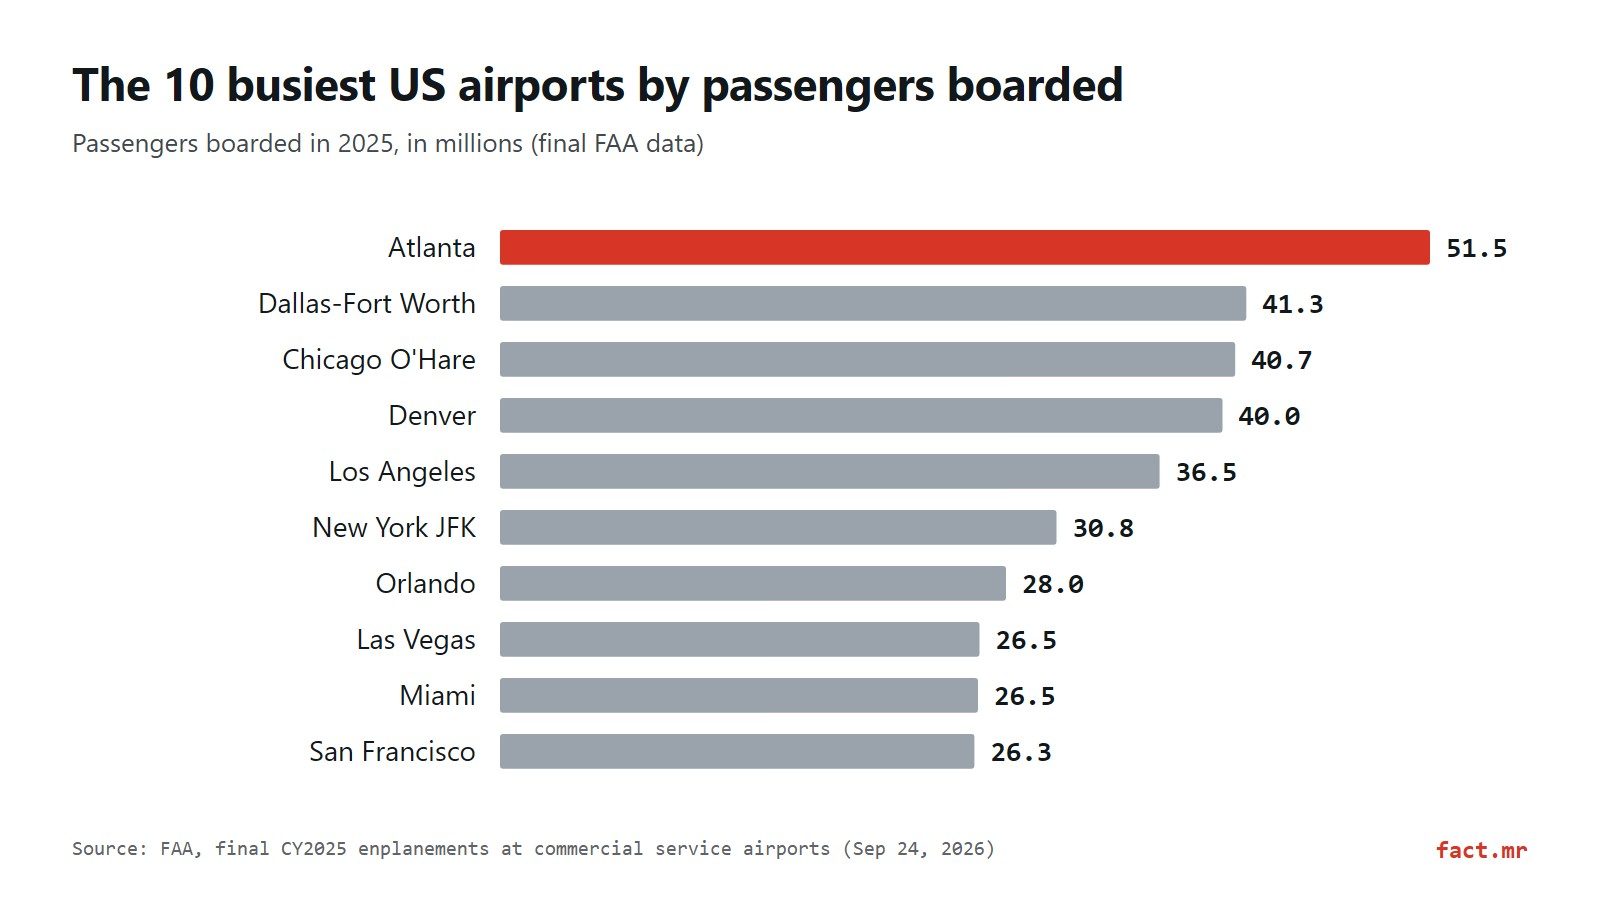
Atlanta is the busiest US airport, with 51.5 million passengers boarded in 2025. The top 50 from final FAA data, plus the biggest by land area and by flights.
In this article
Hartsfield-Jackson Atlanta International is the busiest airport in the US: 51,459,786 passengers boarded there in 2025, according to final Federal Aviation Administration (FAA) figures published on September 24, 2026. Dallas-Fort Worth (41,297,009) and Chicago O'Hare (40,680,735) come next. Measure by land instead and the biggest is Denver International, at 33,531 acres, almost twice the size of Dallas-Fort Worth. Measure by flights and Chicago O'Hare leads, with 857,392 landings and takeoffs.
Key points
- Atlanta kept first place in 2025 even though its boardings fell 2.0% from 2024.
- Chicago O'Hare passed Denver for third, with boardings up 5.5%.
- The 30 airports the FAA classes as large hubs handled 682.5 million boardings, 70.1% of the 973.0 million counted at the 516 commercial service airports in its file.
- That national count fell 1.0% from 982.7 million in 2024, and 34 of the top 50 airports lost boardings.
- These are final figures for calendar 2025. The FAA says preliminary 2026 data will be available in June 2027.
The 50 busiest airports in the US
Places 1 to 30 are the airports the FAA classes as large hubs, and places 31 to 50 are medium hubs. The other 466 commercial service airports are in the FAA file.
| Rank | Airport | Code | State | 2025 boardings | 2024 boardings | Change | 2024 rank |
|---|---|---|---|---|---|---|---|
| 1 | Hartsfield-Jackson Atlanta International | ATL | GA | 51,459,786 | 52,511,402 | −2.0% | 1 |
| 2 | Dallas-Fort Worth International | DFW | TX | 41,297,009 | 42,351,316 | −2.5% | 2 |
| 3 | Chicago O'Hare International | ORD | IL | 40,680,735 | 38,575,693 | +5.5% | 4 |
| 4 | Denver International | DEN | CO | 39,976,695 | 40,012,895 | −0.1% | 3 |
| 5 | Los Angeles International | LAX | CA | 36,497,303 | 37,760,834 | −3.3% | 5 |
| 6 | John F. Kennedy International (New York) | JFK | NY | 30,792,806 | 31,466,102 | −2.1% | 6 |
| 7 | Orlando International | MCO | FL | 27,999,709 | 27,859,783 | +0.5% | 9 |
| 8 | Harry Reid International (Las Vegas) | LAS | NV | 26,531,765 | 28,244,966 | −6.1% | 8 |
| 9 | Miami International | MIA | FL | 26,450,972 | 26,588,002 | −0.5% | 10 |
| 10 | San Francisco International | SFO | CA | 26,251,850 | 25,078,968 | +4.7% | 13 |
| 11 | Charlotte Douglas International | CLT | NC | 25,873,555 | 28,523,822 | −9.3% | 7 |
| 12 | Seattle-Tacoma International | SEA | WA | 25,417,071 | 25,414,592 | +0.0% | 12 |
| 13 | Phoenix Sky Harbor International | PHX | AZ | 25,094,817 | 25,595,723 | −2.0% | 11 |
| 14 | Newark Liberty International | EWR | NJ | 23,464,492 | 24,544,320 | −4.4% | 14 |
| 15 | George Bush Intercontinental (Houston) | IAH | TX | 23,265,028 | 23,349,157 | −0.4% | 15 |
| 16 | Boston Logan International | BOS | MA | 21,021,153 | 21,090,721 | −0.3% | 16 |
| 17 | Minneapolis-Saint Paul International | MSP | MN | 17,488,261 | 18,054,481 | −3.1% | 17 |
| 18 | Detroit Metropolitan Wayne County | DTW | MI | 16,294,768 | 16,110,696 | +1.1% | 20 |
| 19 | LaGuardia (New York) | LGA | NY | 16,278,532 | 16,715,567 | −2.6% | 19 |
| 20 | Fort Lauderdale-Hollywood International | FLL | FL | 15,646,752 | 17,096,131 | −8.5% | 18 |
| 21 | Philadelphia International | PHL | PA | 14,779,849 | 15,102,261 | −2.1% | 21 |
| 22 | Washington Dulles International | IAD | VA | 13,859,569 | 13,003,234 | +6.6% | 24 |
| 23 | Salt Lake City International | SLC | UT | 13,429,128 | 13,543,570 | −0.8% | 22 |
| 24 | San Diego International | SAN | CA | 12,675,684 | 12,780,013 | −0.8% | 25 |
| 25 | Nashville International | BNA | TN | 12,549,304 | 12,058,688 | +4.1% | 28 |
| 26 | Baltimore/Washington International Thurgood Marshall | BWI | MD | 12,274,134 | 13,221,461 | −7.2% | 23 |
| 27 | Tampa International | TPA | FL | 12,110,427 | 12,075,591 | +0.3% | 27 |
| 28 | Ronald Reagan Washington National | DCA | VA | 12,003,594 | 12,750,892 | −5.9% | 26 |
| 29 | Austin-Bergstrom International | AUS | TX | 10,651,727 | 10,678,073 | −0.2% | 29 |
| 30 | Daniel K. Inouye International (Honolulu) | HNL | HI | 10,430,353 | 10,449,022 | −0.2% | 30 |
| 31 | Chicago Midway International | MDW | IL | 9,367,712 | 10,360,093 | −9.6% | 31 |
| 32 | Portland International | PDX | OR | 9,054,394 | 8,639,088 | +4.8% | 33 |
| 33 | Dallas Love Field | DAL | TX | 8,151,354 | 8,654,991 | −5.8% | 32 |
| 34 | Raleigh-Durham International | RDU | NC | 7,670,956 | 7,584,394 | +1.1% | 35 |
| 35 | St. Louis Lambert International | STL | MO | 7,483,526 | 7,807,362 | −4.1% | 34 |
| 36 | Sacramento International | SMF | CA | 6,805,910 | 6,679,426 | +1.9% | 37 |
| 37 | William P. Hobby (Houston) | HOU | TX | 6,790,274 | 7,116,967 | −4.6% | 36 |
| 38 | Luis Muñoz Marín International (San Juan) | SJU | Puerto Rico | 6,658,037 | 6,490,669 | +2.6% | 39 |
| 39 | Louis Armstrong New Orleans International | MSY | LA | 6,221,146 | 6,537,092 | −4.8% | 38 |
| 40 | Kansas City International | MCI | MO | 5,613,974 | 5,915,078 | −5.1% | 40 |
| 41 | John Wayne (Orange County) | SNA | CA | 5,521,729 | 5,370,273 | +2.8% | 44 |
| 42 | Southwest Florida International (Fort Myers) | RSW | FL | 5,504,420 | 5,425,293 | +1.5% | 43 |
| 43 | Mineta San José International | SJC | CA | 5,257,421 | 5,822,019 | −9.7% | 41 |
| 44 | San Antonio International | SAT | TX | 5,237,816 | 5,466,684 | −4.2% | 42 |
| 45 | Indianapolis International | IND | IN | 5,221,447 | 5,181,947 | +0.8% | 46 |
| 46 | Cleveland Hopkins International | CLE | OH | 4,855,943 | 4,950,345 | −1.9% | 47 |
| 47 | Pittsburgh International | PIT | PA | 4,792,035 | 4,862,376 | −1.4% | 48 |
| 48 | Oakland San Francisco Bay | OAK | CA | 4,532,494 | 5,292,736 | −14.4% | 45 |
| 49 | John Glenn Columbus International | CMH | OH | 4,396,625 | 4,387,395 | +0.2% | 50 |
| 50 | Cincinnati/Northern Kentucky International | CVG | KY | 4,366,865 | 4,500,414 | −3.0% | 49 |
How this ranking is built
- What it counts: revenue passengers boarding a plane (the FAA's term is enplanements) during calendar 2025. A person who changes planes in Atlanta boards there, so connecting travelers count at the hub.
- Where it comes from: the FAA's Air Carrier Activity Information System, built mainly on the T-100 reports airlines file with the Department of Transportation. Those are the same reports the Bureau of Transportation Statistics publishes. FAA staff and the airports review the numbers before they become final.
- Year and status: final data for 2025, published September 24, 2026. The FAA labels this file final, so these are not preliminary numbers.
- What is included: commercial service airports, meaning publicly owned airports with scheduled service and at least 2,500 boardings a year. Puerto Rico is in the list, so San Juan ranks 38th.
- Our calculation: the FAA publishes the 2025 rank. We took the 2024 rank from the FAA's final 2024 ranking file, and the two files match for all 50 airports here.
"Hub" has two meanings in aviation. The FAA uses large and medium hub for an airport's share of national boardings: 1% or more for a large hub, 0.25% to 1.0% for a medium hub. Airlines use it for the airports where they gather connecting flights. The two lists overlap but are not the same, and the second one is the subject of a section below.
Biggest by size is a different list
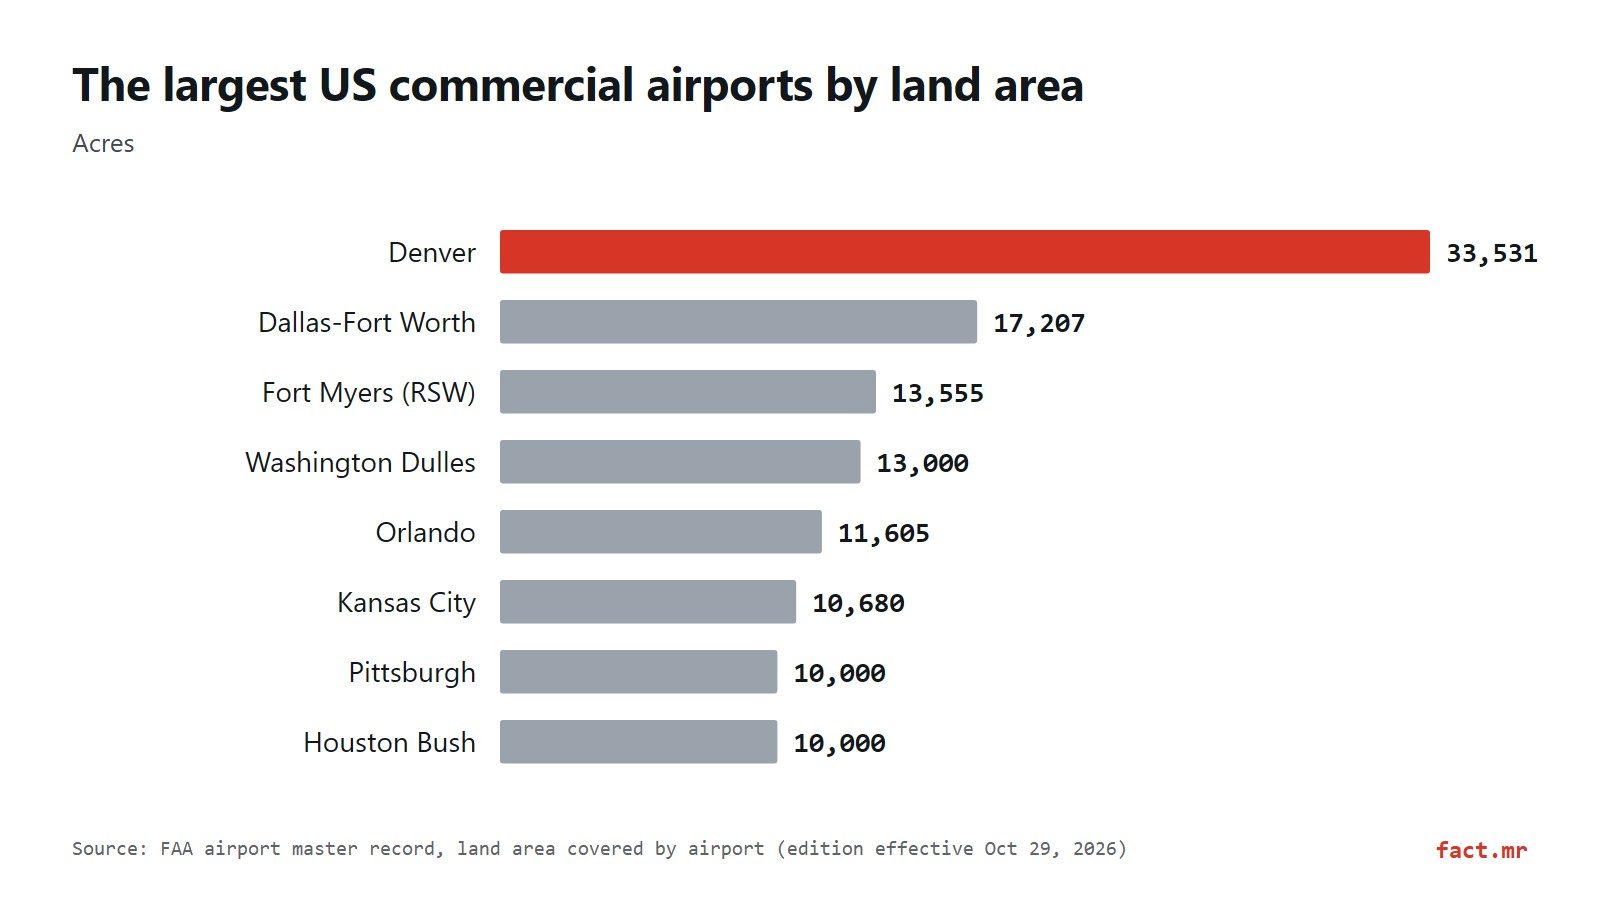
Land is where Denver wins easily. The FAA's airport master record, in the edition effective October 29, 2026, gives Denver International 33,531 acres, about 52.4 square miles. Dallas-Fort Worth has 17,207 acres. Southwest Florida International, in Fort Myers, is third at 13,555 acres, even though it ranks only 42nd by boardings.
| Rank | Airport | Acres | Square miles | Rank by boardings |
|---|---|---|---|---|
| 1 | Denver International (DEN) | 33,531 | 52.4 | 4 |
| 2 | Dallas-Fort Worth International (DFW) | 17,207 | 26.9 | 2 |
| 3 | Southwest Florida International (Fort Myers) (RSW) | 13,555 | 21.2 | 42 |
| 4 | Washington Dulles International (IAD) | 13,000 | 20.3 | 22 |
| 5 | Orlando International (MCO) | 11,605 | 18.1 | 7 |
| 6 | Kansas City International (MCI) | 10,680 | 16.7 | 40 |
| 7 | Pittsburgh International (PIT) | 10,000 | 15.6 | 47 |
| 8 | George Bush Intercontinental (Houston) (IAH) | 10,000 | 15.6 | 15 |
Acreage is what each airport reports to the FAA, and it measures the land the airport covers, not terminal space. Some entries are round figures, like 13,000 acres for Dulles and 10,000 for Pittsburgh and Houston Intercontinental, so read small differences with care. This list covers airports in the boardings file, so military airfields don't enter it.
By flights the order changes again. Airports Council International (ACI) World, which counts landings and takeoffs, puts Chicago O'Hare first in the world in 2025 with 857,392 movements, up 10.5%. Atlanta had 807,625, Dallas-Fort Worth 743,394, Denver 701,335 and Las Vegas 586,871: the five busiest airports on the planet by flights are all in the US.
What changed from 2024
National boardings fell 1.0%, and the top of the table moved more than that average suggests. Chicago O'Hare climbed from 4th to 3rd and San Francisco from 13th to 10th, while Orlando moved from 9th to 7th. Charlotte dropped from 7th to 11th after losing 9.3% of its boardings, the steepest fall in the top 20.
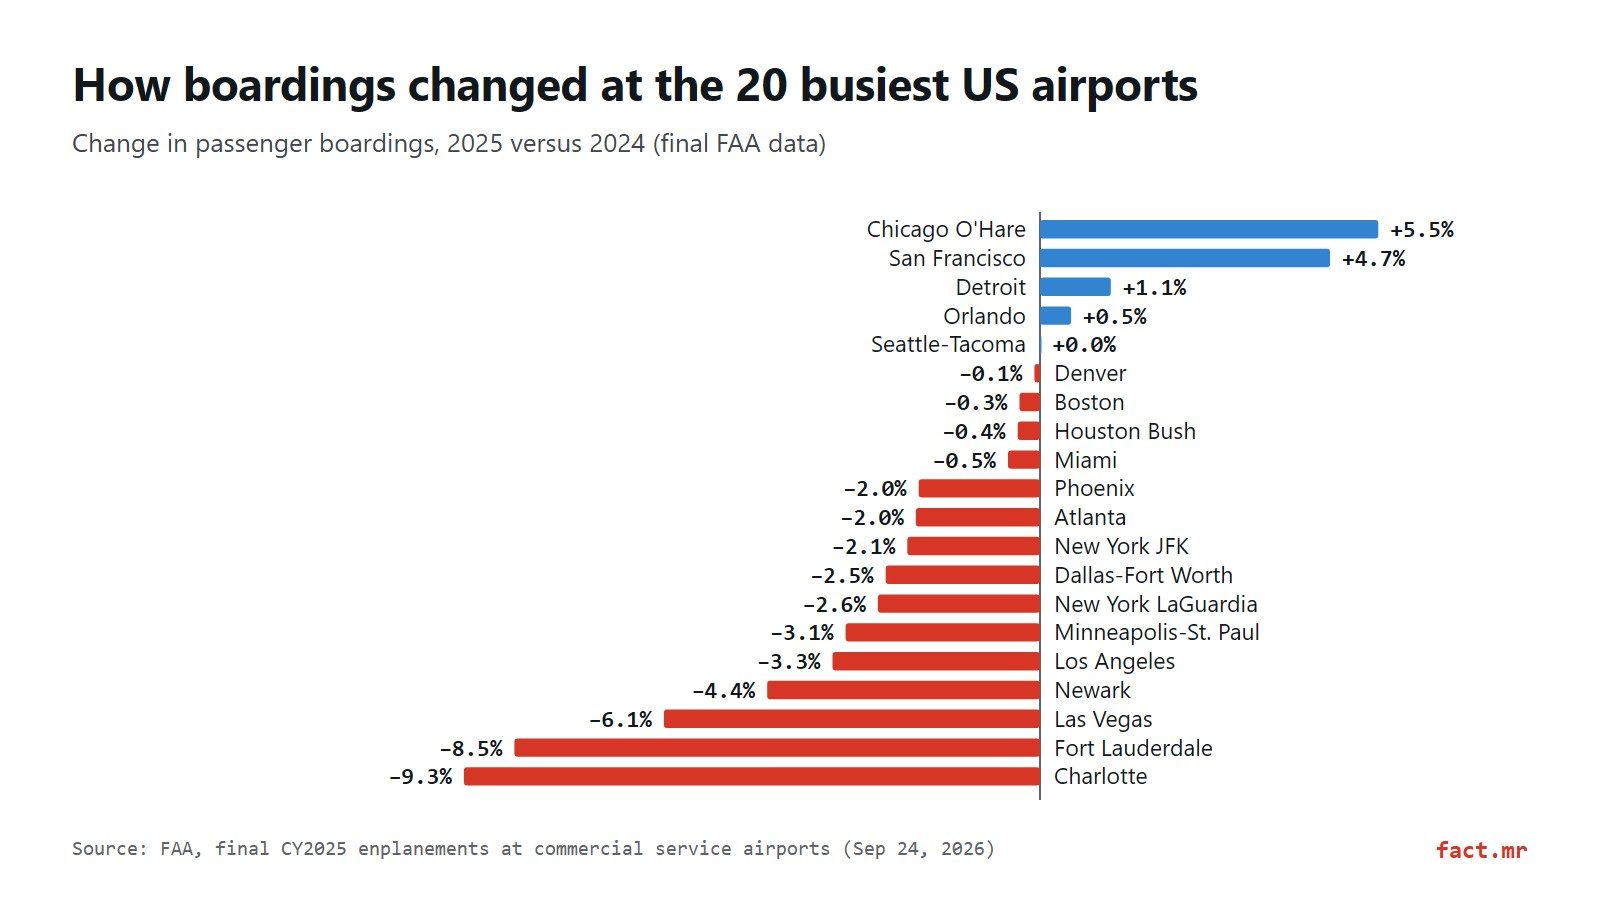
Across the top 50, the biggest rises were at Washington Dulles (+6.6%), Chicago O'Hare (+5.5%), Portland (+4.8%), San Francisco (+4.7%) and Nashville (+4.1%). The biggest falls were at Oakland (−14.4%), San José (−9.7%), Chicago Midway (−9.6%), Charlotte (−9.3%) and Fort Lauderdale (−8.5%).
The FAA file counts passengers and gives no reasons, so this table can't say why an airport rose or fell.
Why these airports sit at the top
Eight of the top 10 are hubs named by at least one of the big US airlines in their annual filings. Airlines channel passengers through hubs, and each traveler who boards a second flight at the hub counts again at that airport. Delta's annual filing names Atlanta first among its four core hubs, and most of Delta's principal offices sit at or near the airport. The FAA file does not separate connecting from local passengers, so it can't say how many of Atlanta's 51.5 million were changing planes.
| Rank | Airport | Hub of (airline 10-K filings for 2025) |
|---|---|---|
| 1 | Hartsfield-Jackson Atlanta International | Delta |
| 2 | Dallas-Fort Worth International | American |
| 3 | Chicago O'Hare International | United, American |
| 4 | Denver International | United |
| 5 | Los Angeles International | Delta, American, United, Alaska |
| 6 | John F. Kennedy International (New York) | Delta; American lists New York |
| 7 | Orlando International | None of the five |
| 8 | Harry Reid International (Las Vegas) | None of the five |
| 9 | Miami International | American |
| 10 | San Francisco International | United, Alaska |
Orlando and Las Vegas stand out: neither appears among the hubs that Delta, American, United or Alaska list in their filings, and Southwest says its network is primarily point-to-point. So their ranks at 7th and 8th aren't explained by those airlines' hub networks. ACI adds another piece of context: four of the five US airports in its global top 20 draw between 80% and 95% of their passengers from domestic flights, and Los Angeles draws 68%.
For the airlines themselves, see our ranking of US airlines, and for the business of running a terminal, our note on airport operations.
Why other lists show 106 million for Atlanta
Lists that give Atlanta about 106 million passengers use ACI's count, which adds arriving and departing passengers. The FAA counts only boardings. ACI's final 2025 ranking, published on July 15, 2026, puts the same five US airports in the same order as the FAA.
| Airport | FAA boardings, 2025 | ACI total passengers, 2025 | ACI world rank |
|---|---|---|---|
| Hartsfield-Jackson Atlanta International | 51,459,786 | 106,302,208 | 1 |
| Dallas-Fort Worth International | 41,297,009 | 85,660,127 | 4 |
| Chicago O'Hare International | 40,680,735 | 84,856,018 | 6 |
| Denver International | 39,976,695 | 82,427,962 | 10 |
| Los Angeles International | 36,497,303 | 73,709,594 | 13 |
Neither figure is wrong; they measure different things. For a ranking of US airports, the FAA's file is the better base because it covers all commercial service airports and is free to download. For comparing with airports abroad, use ACI's.
Frequently asked questions
What is the busiest airport in the US?
Hartsfield-Jackson Atlanta International, with 51,459,786 passengers boarded in 2025, according to final FAA data.
What is the biggest airport in the US by area?
Denver International, at 33,531 acres in the FAA's airport master record, followed by Dallas-Fort Worth at 17,207 acres.
What are the top 10 busiest airports in the US?
Atlanta, Dallas-Fort Worth, Chicago O'Hare, Denver, Los Angeles, New York JFK, Orlando, Las Vegas, Miami and San Francisco, in that order, by 2025 boardings.
Which US airport has the most flights?
Chicago O'Hare, with 857,392 landings and takeoffs in 2025, according to ACI World. Atlanta was second with 807,625.
What are the 30 busiest airports in the US?
They are the first 30 rows of the table above, the airports the FAA classes as large hubs. Together they handled 70.1% of the boardings in the FAA file.
Which airports will be the busiest in 2026?
There is no full-year figure yet. The FAA says preliminary 2026 data will be available in June 2027 and final data in late August 2027, so 2025 is the latest complete year.
Sources
- Federal Aviation Administration, "Final CY2025 Enplanements at All Commercial Service Airports (by rank)," September 24, 2026. Boardings, ranks and change. faa.gov. Accessed Nov 9, 2026.
- Federal Aviation Administration, "Passenger Boarding (Enplanement) and All-Cargo Data for U.S. Airports." Publication status and calendar. faa.gov. Accessed Nov 9, 2026.
- Federal Aviation Administration, "Collection and Use of Data." Definition and data sources. faa.gov. Accessed Nov 9, 2026.
- Federal Aviation Administration, "Airport Categories." Hub definitions. faa.gov. Accessed Nov 9, 2026.
- Federal Aviation Administration, final 2024 ranking file, used for the 2024 rank. faa.gov. Accessed Nov 9, 2026.
- Federal Aviation Administration, National Airspace System Resources 28-day subscription, airport base file, land area covered by airport (edition effective October 29, 2026). faa.gov. Accessed Nov 9, 2026.
- ACI World, "World's Busiest Airports: Atlanta Holds, Asia Climbs," July 15, 2026 (final 2025 rankings; passengers and movements). aci.aero. Accessed Nov 9, 2026.
- ACI World, "Busiest airports in the world 2025." Definition of total passengers (enplaned and deplaned, transit counted once). blog.aci.aero. Accessed Nov 9, 2026.
- Delta Air Lines, Form 10-K for 2025. Hubs. sec.gov. Accessed Nov 9, 2026.
- American Airlines Group, Form 10-K for 2025. Hubs. sec.gov. Accessed Nov 9, 2026.
- United Airlines Holdings, Form 10-K for 2025. Hubs. sec.gov. Accessed Nov 9, 2026.
- Alaska Air Group, Form 10-K for 2025. Hubs. sec.gov. Accessed Nov 9, 2026.
- Southwest Airlines, Form 10-K for 2025. Route structure. sec.gov. Accessed Nov 9, 2026.
Charts: our own, with data from sources 1, 5 and 6.
fact.mr is not affiliated with consulting firms with similar names.
Found an error? Write to us at [email protected].