Airport operations: what they include, how much traffic airports handle and figures
Airport operations cover terminal, airside, landside, handling and security. ACI World counted a record 9.8 billion airport passengers in 2025.
In this article
Airport operations are the work that keeps an airport running. That work covers the airside (runways and taxiways), the terminal, the landside roads and parking outside it, ground handling of bags and cargo, and security screening. ACI World's Annual World Airport Traffic Report counted a record 9.8 billion passengers at the world's airports in 2025, along with 131.2 million tonnes of air cargo and 103.1 million aircraft movements.
Key points
- ACI World counted a record 9.8 billion airport passengers in 2025. International traffic grew 6.1% and domestic traffic grew 1.7%.
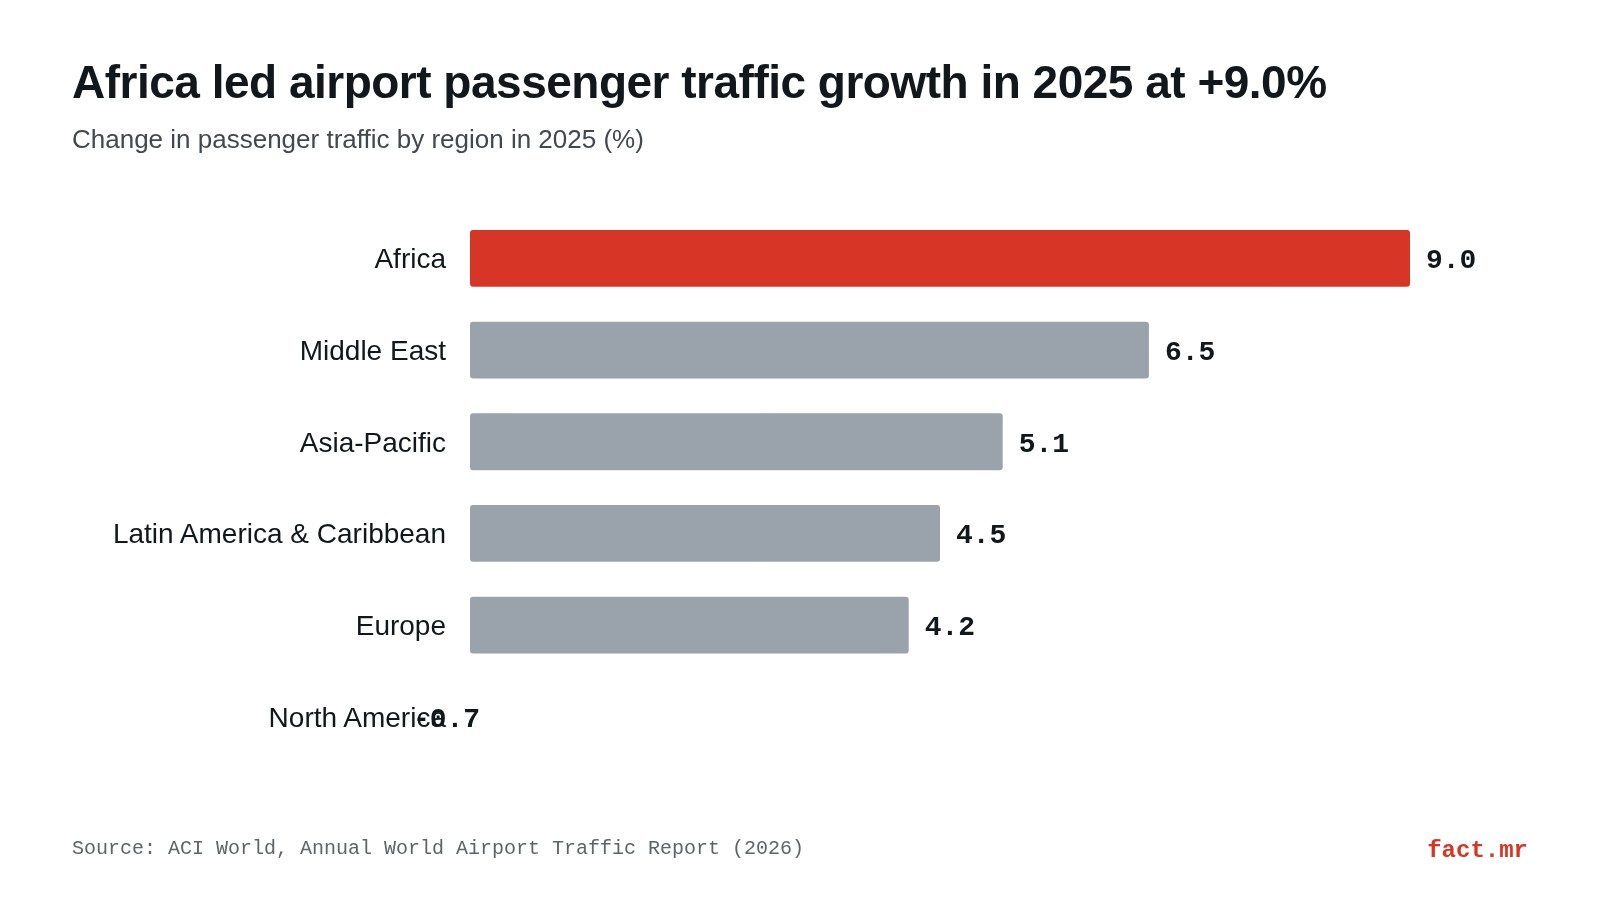
- Africa had the fastest passenger growth in 2025 (+9.0%). North America was the only region that declined (-0.7%).
- Airport passengers and airline passengers carried are two different counts. The World Bank series based on ICAO data shows 4,268,984,474.03796 passengers carried in 2023, about 4.2% below 2019.
- According to Eurostat, 1.1 billion passengers traveled by air in the EU in 2024, up 8.3% from 2023.
- The US federal rule 14 CFR § 139.5 sorts certificated airports into Class I to IV. The "Class A to D" labels found in some market reports are not defined there.
What airport operations include
US federal rules define an airport as an "area of land or other hard surface, excluding water, that is used or intended to be used for the landing and takeoff" of aircraft7. The work around that surface splits into a few operating areas. Each area shows up in a different public statistic.
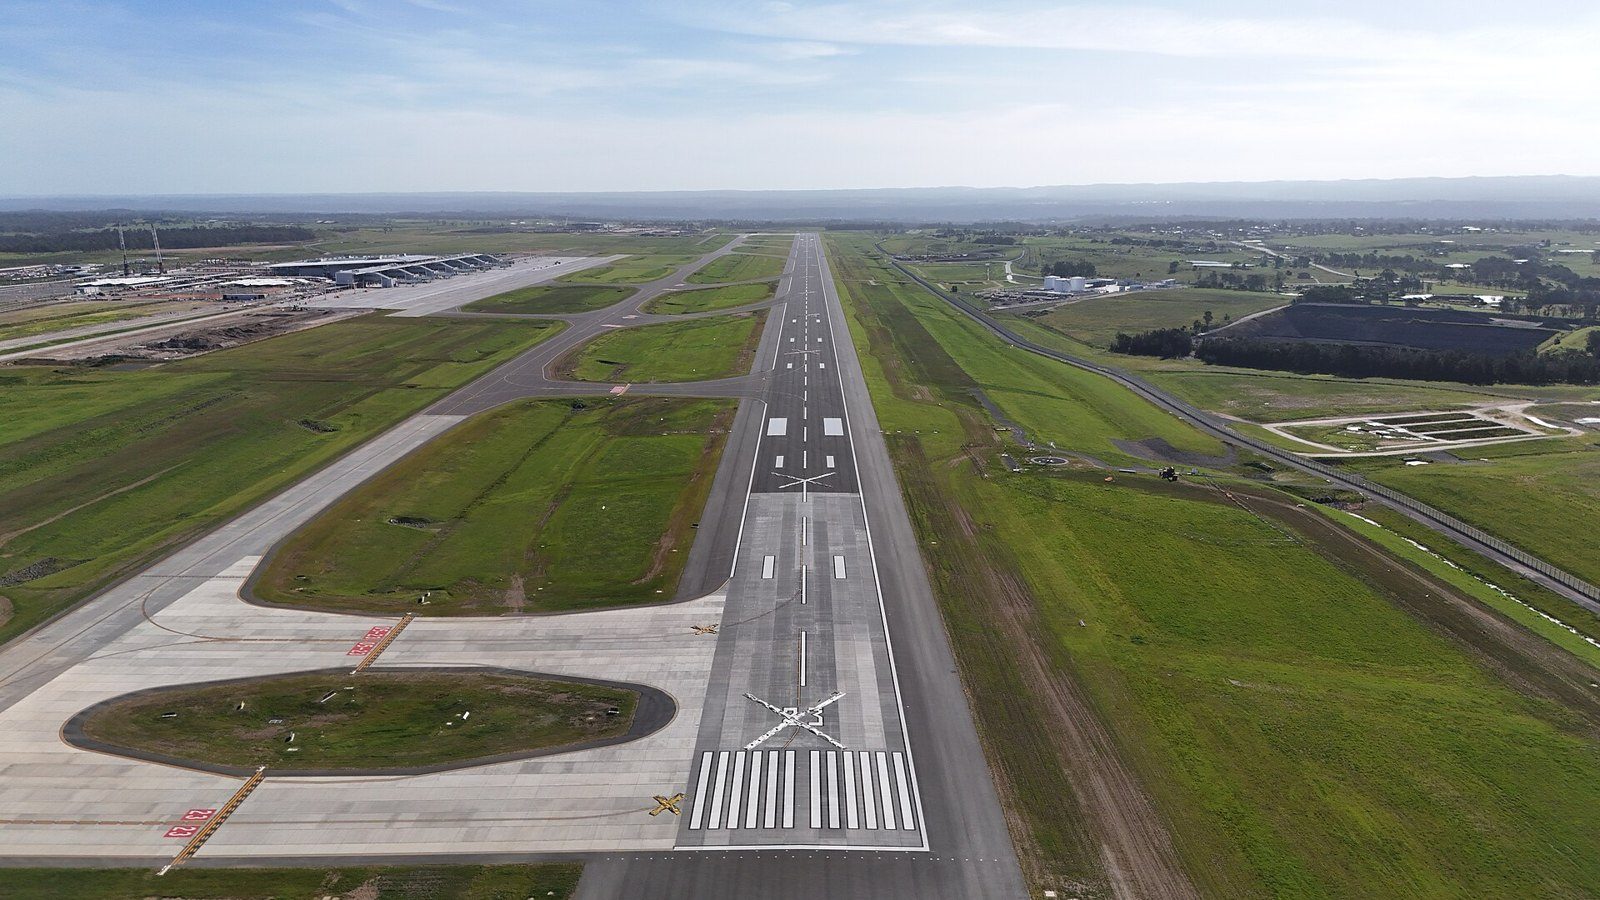
Airside: runways, taxiways and the movement area
The airside is the restricted zone where aircraft move. 14 CFR § 139.5 calls its core the movement area: "the runways, taxiways, and other areas of an airport that are used for taxiing, takeoff, and landing of aircraft." Loading ramps and aircraft parking areas fall outside that definition.
The rule also sets a time window for this work. An air carrier operation is the takeoff or landing of an air carrier aircraft, and it includes the period from 15 minutes before until 15 minutes after that takeoff or landing. That window is how the rule brackets each arrival and departure.
Terminal and landside
Passengers check in, wait and board in the terminal. The landside is everything before that: access roads, parking and the links to the city. Official statistics rarely measure these spaces directly. What they count is people, meaning passengers handled at each airport, and that is the figure ACI World and Eurostat publish.
Ground handling and cargo
Ground handling is the work done around an aircraft parked at the gate, such as loading bags and freight, catering and getting the aircraft ready for its next departure. Cargo runs as a parallel operation with its own warehouses and its own count. ACI World put 2025 air cargo at a record 131.2 million tonnes, up 3.3%1.
Security and safety
Security means screening passengers and bags before they reach the aircraft. In the United States, the Transportation Security Administration (TSA) runs the checkpoints and publishes daily counts of the people it screens. Safety is a separate area: Part 139 describes an Airport Safety Management System (SMS) as "an integrated collection of processes and procedures that ensures a formalized and proactive approach to system safety through risk management."
| Operating area | What happens there | Public data that measures it |
|---|---|---|
| Airside | Takeoffs, landings, taxiing | Aircraft movements (ACI World: 103.1 million in 2025) |
| Terminal and landside | Check-in, waiting, boarding, access | Passengers per airport (ACI World, Eurostat) |
| Ground handling and cargo | Bags, freight, aircraft turnaround | Cargo tonnes (ACI World: 131.2 million in 2025); EU freight and mail (Eurostat) |
| Security | Passenger and bag screening | TSA checkpoint counts (United States) |
How much traffic the world's airports handled in 2025
Airports Council International (ACI), the trade association of the world's airports, publishes the standard global count. The 2026 edition of its Annual World Airport Traffic Report (WATR) uses data from 2,817 commercial airports in more than 185 countries and territories, which is ACI World's largest data set so far. ACI estimates that it captures 97% of scheduled global passenger traffic1.
| Indicator (ACI World) | 2025 | Growth in 2025 |
|---|---|---|
| Airport passengers | 9.8 billion (record) | International +6.1%; domestic +1.7% |
| Air cargo | 131.2 million tonnes (record) | +3.3% |
| Aircraft movements | 103.1 million | +2.0% |
International traffic grew 6.1% in 2025, well ahead of domestic growth of 1.7%. As of January 2026, ACI had 811 members operating over 2,200 airports in more than 160 countries.
Passenger traffic by region
Africa led 2025 with a 9.0% rise in passenger traffic. The Middle East (6.5%), Asia-Pacific (5.1%) and Latin America and the Caribbean (4.5%) came next, and Europe grew 4.2%. North America was the only region to decline, with traffic dipping 0.7% "amid softer domestic demand," in ACI World's words.
| Region | Change in passenger traffic, 2025 |
|---|---|
| Africa | +9.0% |
| Middle East | +6.5% |
| Asia-Pacific | +5.1% |
| Latin America and the Caribbean | +4.5% |
| Europe | +4.2% |
| North America | -0.7% |
For the busiest US airports one by one, see the ranking of the busiest and biggest airports in the US.
The first half of 2026
The report also gives an early look at 2026. Airports handled about 4.7 billion passengers in the first half, up just 0.6% from the same period of 2025. The Middle East had the sharpest drop, with traffic down 21%.
Will the second half close the gap? The 0.6% figure is the latest official reading, and a full-year number for 2026 does not exist yet.
Airport passengers vs. passengers carried
Why does ACI report 9.8 billion passengers for 2025 when the World Bank series shows 4,268,984,474.03796 for 2023? Because the two sources count different things.
ACI World counts passengers at airports, not on flights. The World Bank indicator "Air transport, passengers carried" (IS.AIR.PSGR) comes from ICAO's Civil Aviation Statistics of the World plus ICAO staff estimates, and it counts passengers on airline flights4. Eurostat's definition, written for its own EU statistics, shows the logic of a flight-based count: all passengers on a flight are "counted once only and not repeatedly on each individual stage of that flight," and direct transit passengers are left out3.
The two sources also cover different years. The latest World Bank value is for 2023 and ACI's latest is for 2025, so dividing one by the other would mix two periods (and the result would mean nothing).
| Year | Passengers carried, world (World Bank/ICAO) |
|---|---|
| 2015 | 3,525,115,153 |
| 2016 | 3,760,774,350 |
| 2017 | 4,025,616,011.77031 |
| 2018 | 4,293,921,426.12931 |
| 2019 | 4,455,690,101.02828 |
| 2020 | 1,771,894,087.0245 |
| 2021 | 2,279,974,770.123 |
| 2022 | 3,230,288,279.667 |
| 2023 | 4,268,984,474.03796 |
The series shows a sharp break in 2020, when passengers carried fell 60.2% from 20195. In 2023 the count rose 32.2% over 2022. It still ended about 4.2% below the 2019 level of 4,455,690,101.02828.
Europe: what Eurostat counts
Eurostat put the number of air passengers in the EU at 1.1 billion in 2024, up 8.3% from 973 million in 20232. That total is above the 1.0 billion recorded in 2019, which Eurostat uses as the pre-pandemic reference.
Growth varied by country. Hungary (+19.2%), Czechia (+18.9%) and Estonia (+17.8%) had the largest increases, while Sweden (+1.3%), Bulgaria (+3.8%) and France and Ireland (both +4.6%) had the smallest. EU air freight and mail rose 8.7%.
By type of route, extra-EU transport made up 49.3% of EU air passengers in 2024, intra-EU transport 36.4% and domestic flights 14.3%. The definitions behind these counts come from Regulation (EC) No 1358/2003 of 31 July 2003.
| Airport | Passengers, 2024 | Change vs. 2023 |
|---|---|---|
| Paris/Charles de Gaulle | 70.3 million | +4.3% |
| Amsterdam/Schiphol | 66.8 million | +8.0% |
| Madrid/Barajas | 66.1 million | +9.9% |
| Frankfurt/Main | 61.5 million | +3.7% |
| Barcelona/El Prat | 54.9 million | +10.3% |
| Roma/Fiumicino | 48.7 million (news release) / 46.7 million (Statistics Explained) | +20.8% (news release) |
| Munich (München) | 41.5 million | Not given |
Rome Fiumicino is listed with different figures on two Eurostat pages. The news release ranks it sixth with 48.7 million passengers, and the Statistics Explained article gives 46.7 million. Both figures are shown above because neither page says which one is final.
A week of US checkpoint screening
For the United States, the most up-to-date public figure is the TSA's daily count of passengers screened at its checkpoints6. The TSA updates it Monday through Friday by 9 a.m., and holiday weeks can run late.
| Date (2026) | Passengers screened by the TSA |
|---|---|
| Thursday, November 5 | 2,610,670 |
| Friday, November 6 | 2,600,278 |
| Saturday, November 7 | 2,005,258 |
| Sunday, November 8 | 2,749,897 |
| Monday, November 9 | 2,535,058 |
| Tuesday, November 10 | 1,971,234 |
| Wednesday, November 11 | 2,207,483 |
The TSA screened 16,679,878 people from November 5 to November 11, 2026, an average of about 2,382,840 a day. Sunday was the busiest day at 2,749,897 and Tuesday was the quietest at 1,971,234.
A checkpoint count measures people screened, which makes it a separate figure from ACI's airport passengers.
The airlines behind these numbers are covered in the guide to the top 10 airlines in the US.
"Class A to D" labels and the classes US rules define
Some commercial reports sort airports by size into Class A to Class D. Those labels are not defined in 14 CFR § 139.5, the US rule that certificates airports serving air carriers. That rule uses Class I to IV, and each class depends on the type of air carrier operation the airport is certificated to serve.
| Class (14 CFR § 139.5) | Certificated to serve |
|---|---|
| Class I | Scheduled operations of large air carrier aircraft |
| Class II | Scheduled operations of small air carrier aircraft and unscheduled operations of large ones; no scheduled operations of large air carrier aircraft |
| Class III | Scheduled operations of small air carrier aircraft |
| Class IV | Unscheduled passenger operations of large air carrier aircraft |
Seat count sets aircraft size. A large air carrier aircraft is designed for at least 31 passenger seats, and a small one for more than 9 and fewer than 31. An Airport Operating Certificate issued under Part 139 allows an airport to operate as a Class I, II, III or IV airport.
But the rule says nothing about terminal size or annual passenger counts. The section was first published at 69 FR 6424 on February 10, 2004, and the latest amendment it cites is Amdt. 139-28, 88 FR 11671, of February 23, 2023. When a report uses letter classes without explaining them, the guide on how to read industry reports covers what to check first.
None of the official sources on this page (ACI World, Eurostat, the World Bank series based on ICAO data, the TSA and the federal rule text) publishes a dollar value for "airport operations" as a sector, so traffic counts are the closest public measure of its size.
Frequently asked questions
What are the main areas of airport operations?
The main areas are the airside (runways, taxiways and the movement area defined in 14 CFR § 139.5), the terminal and landside, ground handling and cargo, and security screening. ACI World measured 2025 activity at 103.1 million aircraft movements, 9.8 billion passengers and 131.2 million tonnes of air cargo.
How many passengers do the world's airports handle in a year?
ACI World's 2026 traffic report counted a record 9.8 billion airport passengers in 2025. The data covers 2,817 commercial airports and an estimated 97% of scheduled traffic. In the first half of 2026, airports handled about 4.7 billion passengers, up 0.6% from the same period of 2025.
Why is the World Bank passenger figure lower than ACI's?
The World Bank series IS.AIR.PSGR is based on ICAO data and counts passengers carried on airline flights. ACI World counts passengers at airports, and the two measures are not comparable. The latest World Bank value is 4,268,984,474.03796 for 2023, while ACI's 9.8 billion figure is for 2025.
Is a Class I airport the same as a Class A airport?
No official definition links the two. Class I to IV come from 14 CFR § 139.5, where a Class I airport serves scheduled operations of large air carrier aircraft (at least 31 passenger seats). The Class A to D labels appear in market reports and are not defined in that rule.
Sources
- ACI World, "Global Airport Passenger Traffic Reaches Record 9.8 Billion in 2025, Airports Council International World reports" (2026). Airport passengers, air cargo and aircraft movements in 2025, growth by region, first half of 2026, ACI membership and the scope of the WATR. aci.aero. Accessed Nov 12, 2026.
- Eurostat, "Number of air passengers up 8% in 2024" (2025). EU air passengers in 2023 and 2024, change by country, air freight and mail, and passengers at the largest airports. ec.europa.eu. Accessed Nov 12, 2026.
- Eurostat, "Air passenger transport statistics", Statistics Explained (2025). EU passengers in 2019, shares of extra-EU, intra-EU and domestic transport, Rome Fiumicino and München figures, the definition of passengers carried and Regulation (EC) No 1358/2003. ec.europa.eu. Accessed Nov 12, 2026.
- World Bank, "Air transport, passengers carried" (IS.AIR.PSGR). Indicator definition and original source (ICAO). data.worldbank.org. Accessed Nov 12, 2026.
- World Bank API, "IS.AIR.PSGR", World. Annual values of passengers carried, 2015 to 2023. api.worldbank.org. Accessed Nov 12, 2026.
- Transportation Security Administration, "TSA checkpoint travel numbers". Daily passengers screened from November 5 to November 11, 2026, and update schedule. tsa.gov. Accessed Nov 12, 2026.
- Legal Information Institute, Cornell Law School, "14 CFR § 139.5 - Definitions". Definitions of airport, movement area, air carrier operation and SMS, airport classes I to IV, aircraft size by seats, and publication history. law.cornell.edu. Accessed Nov 12, 2026.
Chart: our own, with data from ACI World, Annual World Airport Traffic Report (2026) (source 1).
Photo: BulbazaurREX (CC0, Wikimedia Commons).
fact.mr is not affiliated with consulting firms with similar names.
Found an error? Write to us at [email protected].